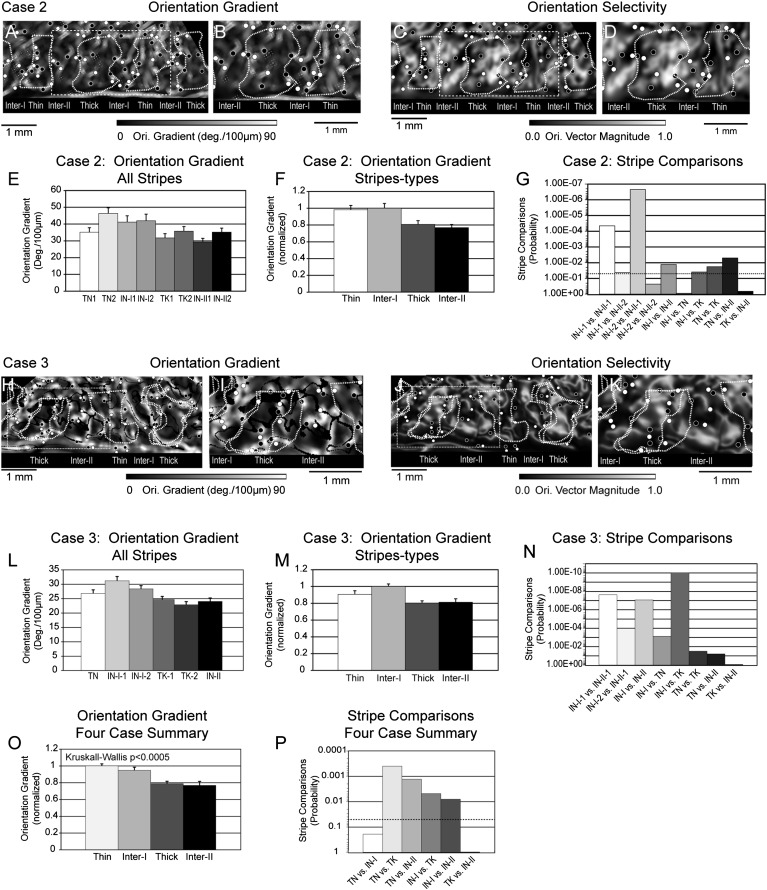
Figure 5.
Relationship between orientation gradient and CO stripe compartments. (A) Orientation gradient map illustrating the local rate of change of preferred angle. The preferred angle gradient was calculated for each pixel across 4 directions across a 64-μm radius (2 pixels). Bright pixels indicate a higher rate of local change in preferred angle. (B) Enlargement of the central portion of the orientation gradient map indicated by the dashed white rectangle in panel A. Higher orientation gradient magnitude was exhibited by the thin stripe and type-I interstripe in this cortical region. (C) Orientation vector magnitude map corresponding to panel A that illustrates the largely complimentary relationship between orientation gradient and vector magnitude. (D) Enlargement of the dashed white rectangle in panel C highlighting the orientation selectivity within the central 4 stripe compartments. (E) Histogram illustrating the average orientation gradient exhibited by the 8 stripe compartments illustrated in panel A. Higher average rates of preferred angle change were observed in the 2 thin stripes and type-I interstripes as compared with thick stripe and type-II interstripe. (F) Histogram illustrating the normalized average orientation gradient of the 4 stripe-types in Case 2. The highest average rate of preferred angle change was observed in the type-I interstripe and the lowest orientation gradient was observed in the type-II interstripe. (G) Statistical probability of stripe–stripe comparisons based on the nonparametric Wilcoxon test. The dashed line indicates the P < 0.05 level. See text for details. (H) Orientation gradient map illustrating the local rate of change of preferred angle relative to the CO stripe borders from 2 histological sections (dashed white contours). The preferred angle gradient was calculated across a 42-μm radius (2 pixels) and expressed as angle change/100 μm. (I) Enlargement of the central portion of the orientation gradient map indicated by the dashed white rectangle in panel H. Higher orientation gradient magnitude was exhibited by the thin stripe and type-I interstripe in this cortical region. (J) Orientation vector magnitude map corresponding to panel H that illustrates the largely complimentary relationship between orientation gradient and vector magnitude. (K) Enlargement of the dashed white rectangle in panel J highlighting the orientation selectivity within the central 4 stripe compartments. (L) Histogram illustrating the average orientation gradient exhibited by the 6 stripe compartments illustrated in panel H. Higher average rates of preferred angle change- interstripe. (M) Histogram illustrating the normalized average orientation gradient of the 4 stripe-types in case 3. The highest average rate of preferred angle change was observed in the type-I interstripe and the lowest orientation gradient was observed in the thick stripe. (N) Statistical probability of stripe–stripe comparisons based on the nonparametric Wilcoxon test. See text for details. (O) Normalized average orientation gradient magnitude for each stripe-type across the 4 cases. Overall, the largest orientation gradient was observed in thin stripes and the lowest gradient was observed in type-II interstripes. Orientation gradient varies significantly across CO stripe compartments (P < 0.0005; Kruskal–Wallis nonparametric test). (P) Histogram illustrating the probabilities associated with the pair-wise comparisons of orientation gradient magnitude between different CO stripe compartments across all 4 cases. Dashed line indicates P < 0.05. See text for details.

