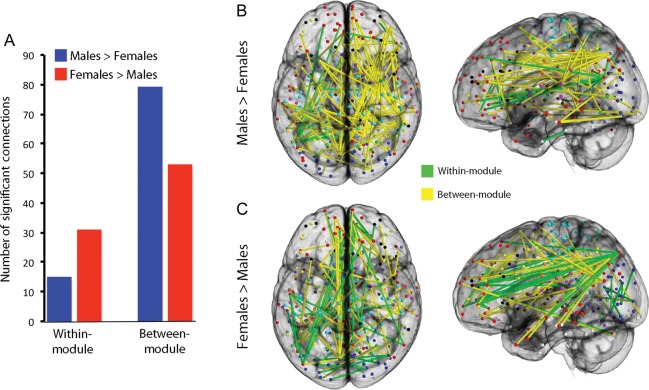
Figure 5.
Connections that are stronger in females are more likely to be within-module, whereas connections that are stronger in males are more likely to be between-module (A; χ2 = 10.16, P = 0.001). Significantly different edges (from Fig. 4) are here displayed separately for each sex; within-module connections are displayed in green, between-module connections are in yellow. Males have a greater predominance of between-module connections (B), whereas the proportion of within-module connections is relatively higher in females (C). As prior, all connections reported as significant are above an FDR-corrected threshold (Q < 0.05).

