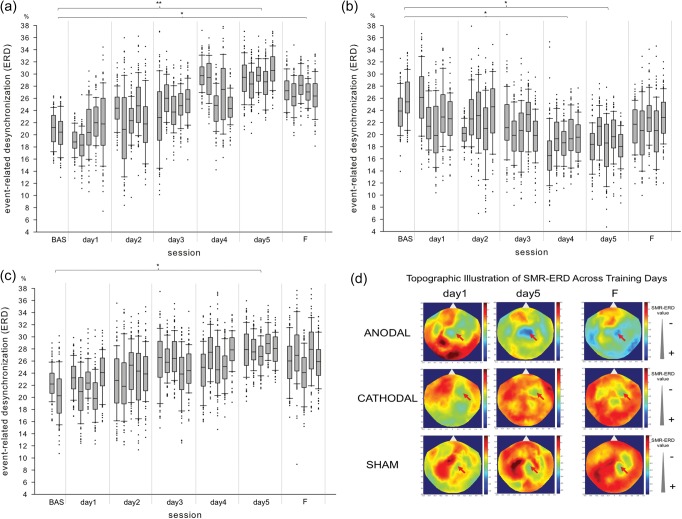
Figure 3.
Hebbian learning to control SMR oscillations in a representative participant of each group receiving anodal (a), cathodal (b) or sham (c) stimulation. Note the progressive improvement in SMR-ERD control in the participant receiving sham (P < 0.05) and anodal (P < 0.01) stimulation. The participant receiving cathodal tDCS, on the contrary, shows a progressive and significant worsening of SMR-ERD control over the 5 training days. Whiskers indicate one standard deviation above and below the mean of the data in each block. Trials with SMR-ERD values exceeding one standard deviation are represented by dots. (d) Shows the topographic distribution of SMR-ERD in the same participants at training Day 1, Day 5 and follow-up test after 30 days (F) (blue = positive SMR-ERD values, red = negative SMR-ERD values; red arrows indicate the location of sensors used for SMR-ERD control). *P < 0.05; **P < 0.01.

