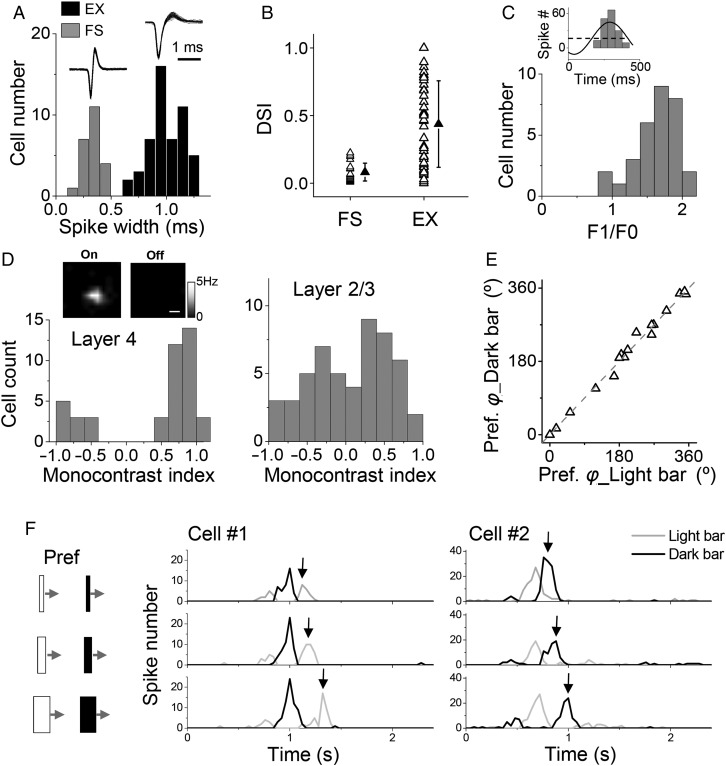
Figure 1.
Direction selectivity of layer 4 neurons in mouse V1. (A) Distribution of spike widths for all recorded layer 4 neurons. Spike width was quantified as the interval between the trough and peak of the average spike waveform of the cell. Fast-spiking cells had spike widths of <0.5 ms. EX, putative excitatory cells. Superimposed 50 individual spikes are shown for an example FS and EX cell, respectively (top inset). (B) DSIs of recorded FS (n = 23) and excitatory (n = 52) neurons. Solid symbols represent mean ± SD. (C) Distribution of F1/F0 ratios for layer 4 excitatory neurons. Top inset, cycle-averaged PSTH for spike responses (baseline subtracted) of an example cell to drifting sinusoidal gratings at the preferred direction, fit to a sinusoid (black line). Black dash line indicates F0. (D) Distribution of monocontrast indices for excitatory neurons in layer 4 (left) and layer 2/3 (right). The index is 1 or −1 if the cell only shows spike responses to one contrast (On or Off, respectively). Top inset, spatial maps of On and Off spike responses of an example layer 4 cells, which showed only an On subfield. Scale bar: 10°. (E) The preferred directional angle φ measured with dark drifting bars versus that measured with light drifting bars. Gray dash line is the identity line. Each data point represents 1 cell. (F) PSTH for spike responses of 2 representative cells to bright and dark drifting bars of preferred orientation and different bar widths (4°, 8°, 16°, illustrated on the left). Cell#1 had a dominant “Off” subfield. Black arrows mark the discharge response to the withdrawal of the light bar from the Off subfield, the timing of which changed with increasing bar width. Cell#2 had a dominant “On” subfield.

