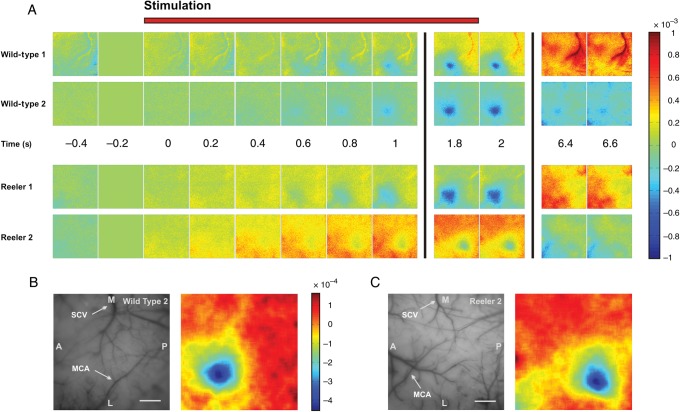
Figure 2.
The hemodynamic response to single-whisker stimulation in WT and reeler mice. (A) Time series of camera frames illustrating the response to stimulation of whisker C2 at 5 Hz for 2 s in 2 representative examples of WT and reeler animals. Stimulation starts at time 0, each frame represents 200 ms. The camera frame immediately before stimulation onset was used as reference for normalization; the scale bar represents fractional change in reflectance with respect to that frame. Stimulation evoked a localized hemodynamic response corresponding to the sensory representation of whisker C2 in WT but also in reeler mice. Neither the mean latency nor mean duration of the evoked intrinsic signal differed significantly between genotypes (one-way ANOVA, P = 0.7 and P = 0.46, respectively). (B and C) Left, photograph of the surface vasculature in 2 representative examples corresponding to the data in A. SCV, superior cerebral vein, MCA, middle cerebral artery, M, medial, L, lateral, A, anterior, P, posterior. Scale bar: 500 μm. Right, sensory maps obtained by binning 15 frames spanning the period from 1 to 4 s after stimulation, applying Gaussian blur with σ = 86 μm and subtracting the median of the filtered image.

