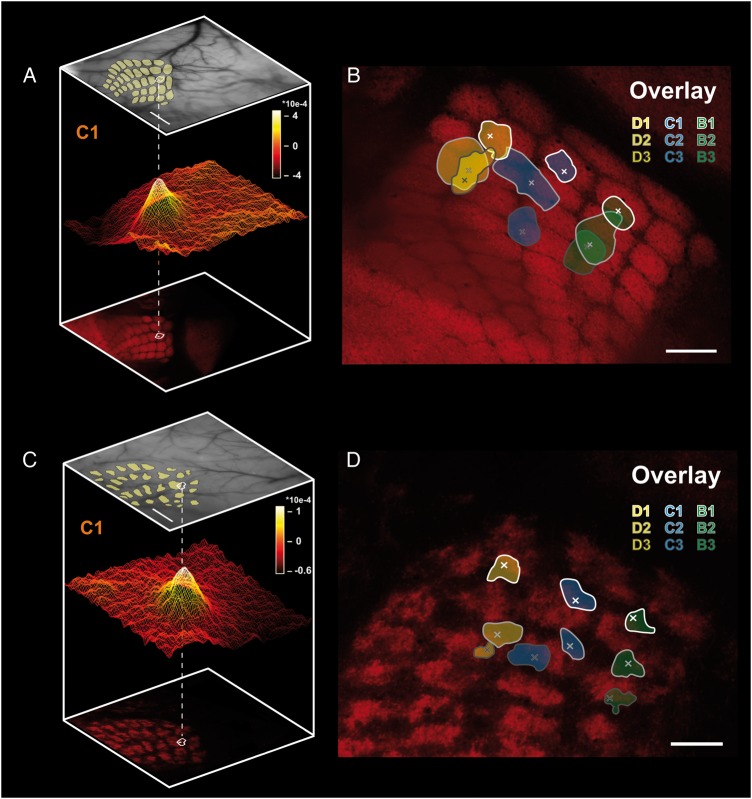
Figure 3.
Sensory map organization in WT and reeler somatosensory cortex. (A and C) Pseudo 3D-reconstruction of the location of the hemodynamic response evoked by single-whisker stimulation with respect to the barrel field in WTand reeler, respectively. Top: photograph of the superficial blood vessels acquired during the experiment under a 546 nm wavelength illumination (scale bar: 500 μm). Bottom: the barrel field was reconstructed postmortem from tangential sections through the barrel cortex of LIVtdTomato mice. Middle: surface plot of the averaged intrinsic signal evoked by stimulating the C1 whisker at 5 Hz for 2 s (scale bar in absolute values). The location of the peak and 90% of maximum isoline were mapped on the barrel field after aligning the blood vessels present in the reconstructions of the serial tangential sections with those present in the pial surface photograph of the living animal. (B and D) overlay of peak (x) and 90% maximum isolines locations of 9 intrinsic signals evoked by sequential stimulation of 9 whiskers in the same WT and reeler mouse, respectively. The spatial relationship between the functional intrinsic signals locations show a rough match with those of individual structural barrels. Scale bar: 250 μm.

