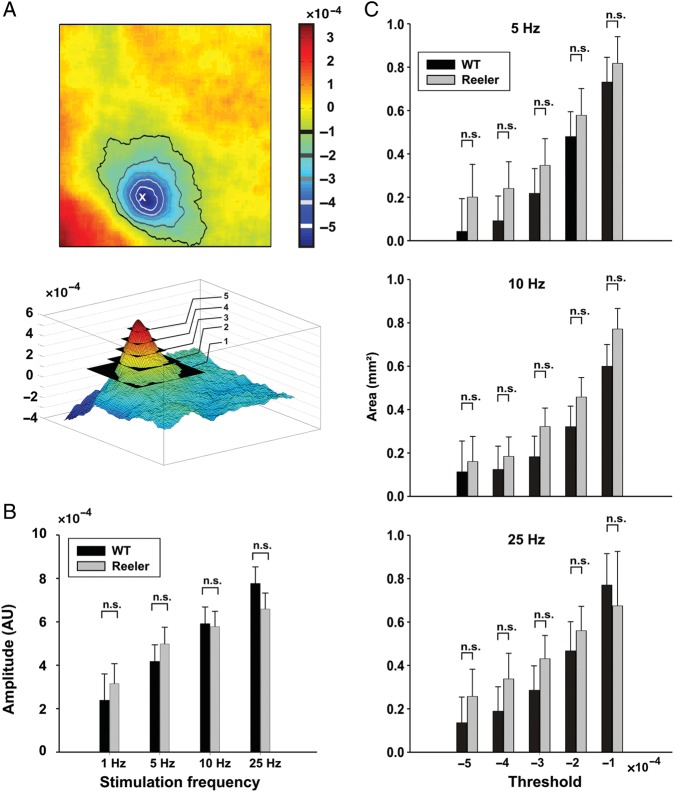
Figure 4.
Stimulus representation in WT and reeler mice. (A) Top, representation of whisker C2 overlaid with threshold isolines. The level of subsequent thresholds is indicated on the scale bar, which represents fractional change in reflectance. The asterisk labels the peak amplitude of the evoked response. Bottom, same data as top in absolute value. (B) Peak amplitude of evoked response (in fractional change in reflectance, absolute value) as a function of stimulation frequency (mean ± standard error of mean [SEM], n.s.: nonsignificant, ANOVA, P = 0.71). (C) Area encompassed within isolines of thresholds indicated in A as a function of stimulation frequency (in mm2, mean ± SEM, n.s.: nonsignificant, ANOVA, P = 0.12, P = 0.09, and P = 0.35 for 5, 10, and 25 Hz, respectively). The 1 Hz stimulation frequency did not evoke responses that consistently reached threshold values and is therefore not represented here. N = 11 WT and 12 reeler.

