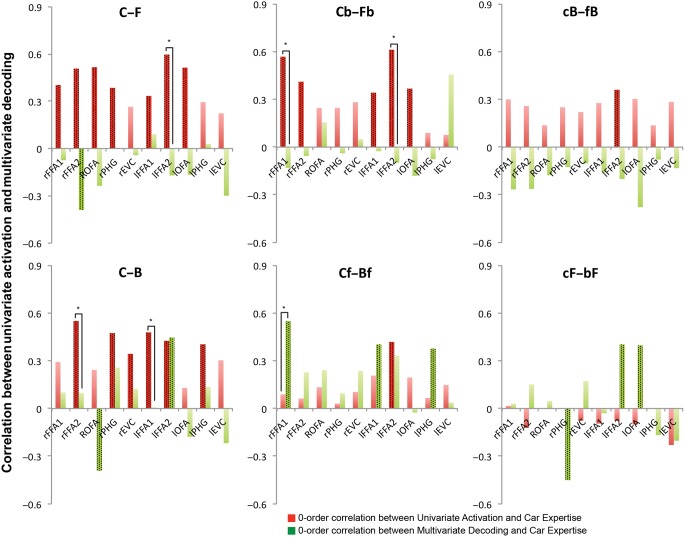
Figure 4.
Bar graphs depict the correlations between car expertise and univariate or multivariate effects plotted side-by-side for isolated, attended and ignored conditions. The stippled bars are those that are significant, using one-tail P < 0.05 as in Table 2 for the univariate analyses, and 2-tails <0.05 for the MVP analyses. Brackets indicate Steiger's Z tests comparing the absolute values of the expertise effects for univariate and multivariate analyses, 2-tails P < 0.05.

