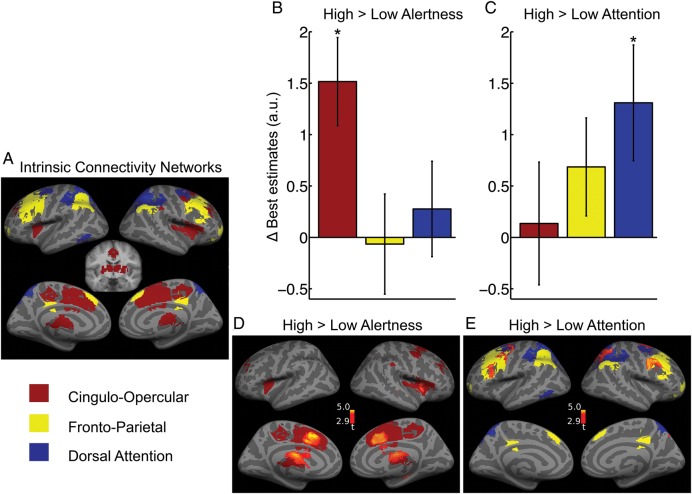
Figure 3.
Effects of alertness and attention demands on activation levels. (A) Task-positive ICNs defined using resting-state seed-based functional connectivity. FWE-corrected P < 0.05, extent >20 voxels. Coronal slice shows subcortical areas of CO (y = −10). (B and C) Change in estimated activity levels with experimental conditions for the average signal in each of the 3 ICNs. Only the CO ICN showed higher activity under heightened alertness demand (B). Only the DAT ICN increased activity due to increased selective attention demand (C). Error bars show ± standard error. (D and E) Voxel-wise mapping of the contrasts previously investigated in (B and C). The differential activation is overlaid on the corresponding ICNs. P < 0.005 uncorrected, extent >50 voxels.

