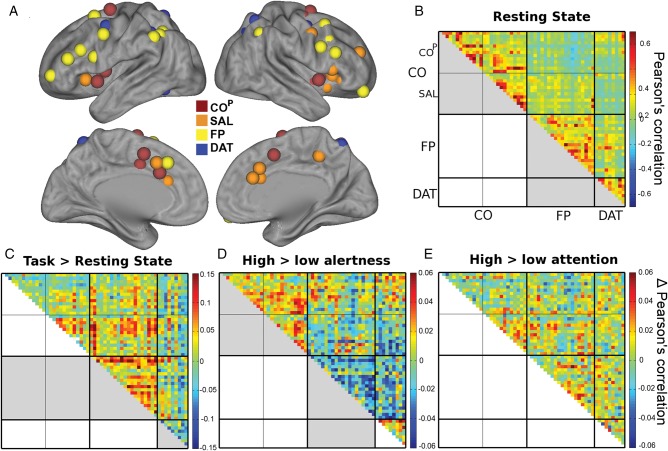
Figure 4.
Effects of overall task, alertness, and selective attention demands on functional connectivity. (A) Spherical VOIs from a functional atlas (Power et al. 2011). (B) Resting-state connectivity confirms strong connectivity between COP and SAL, and (to a lesser extend) between FP and DAT. (C) During task when compared with rest, an increase in connectivity is observed in the FP network as well as between FP and CO networks. DAT network becomes less integrated. (D) Matrix shows differences in pair-wise correlations for high > low alertness demand. The CO network showed a significant connectivity increase while the FP network reduced connectivity under high alertness. The previously strong correlations between FP and DAT networks significantly decreased with heightened alertness. (E) Matrix shows differences in pair-wise correlations for high > low attention. This contrast did not show any differences within or across networks. Thick black divisions indicate network boundaries. Thin black lines subdivide CO into COP and SAL. Significant contrasts in between or within-network correlations (averaged across region-pairs) are marked in gray in the lower triangle of matrices. Note that the scale in B represents correlations, while the scales in C and D) represent differences in correlations.

