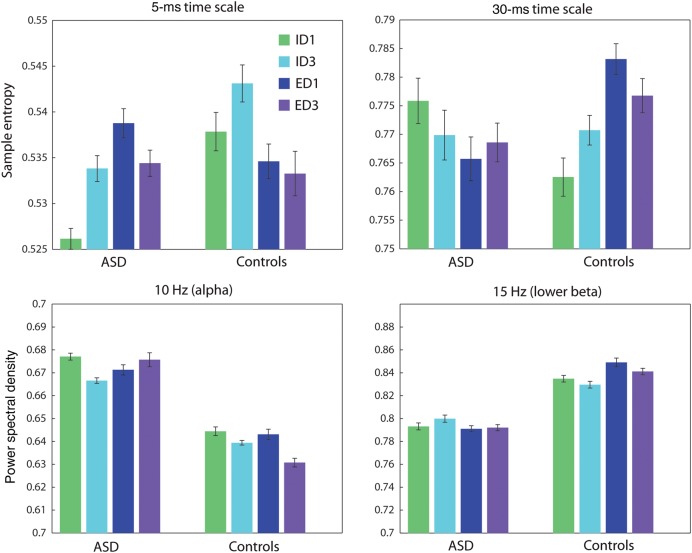
Figure 3.
Groups means for MSE and PSD. Group means for both measures are presented for one randomly selected source. Error bars represent the standard error. Top: Group means for the MSE analysis, at 2 time scales. The data suggest a group by condition interaction, which is confirmed by the subsequent PLS analysis. Bottom: Group means for the PSD analysis, at 2 frequencies. The data suggest a group effect, which is confirmed by the subsequent PLS analysis.

