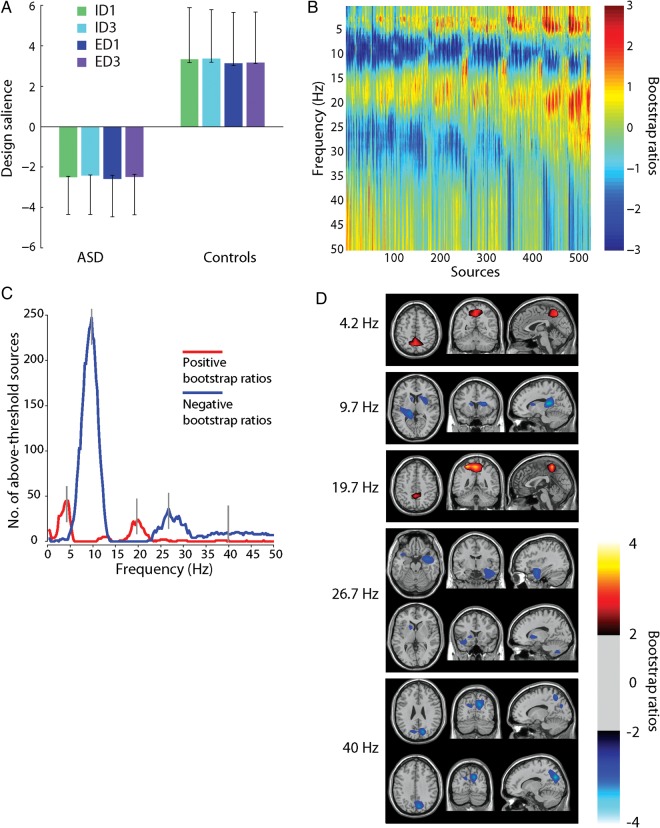
Figure 4.
PLS analysis of PSD. Taken together, (A) and (B) represent the dominant latent variable in the data, accounting for the greatest covariance between the study design and neural activity (PSD). (A) The optimal combination (contrast) of groups and conditions, weighted by their contribution to the latent variable. Error bars are estimated by bootstrap resampling. (B) Bootstrap ratios: the optimal combination (spatiotemporal pattern) of sources and frequencies, weighted by the reliability of their contribution to the latent variable. For a given source and frequency, a high-valued positive bootstrap ratio means that the contrast in (A) is reliably expressed (i.e., greater power for the Control group). A high-valued negative bootstrap ratio means that the opposite contrast is reliably expressed (i.e., greater power for the ASD group). (C) The number of sources with positive/negative bootstrap ratios exceeding ±2. “Peak” frequencies (4, 10, 20, 27, and 40 Hz) are marked by gray lines. (D) Statistical maps showing networks of regions that most reliably express the contrast in (A), shown for each of the peak frequencies in (C).

