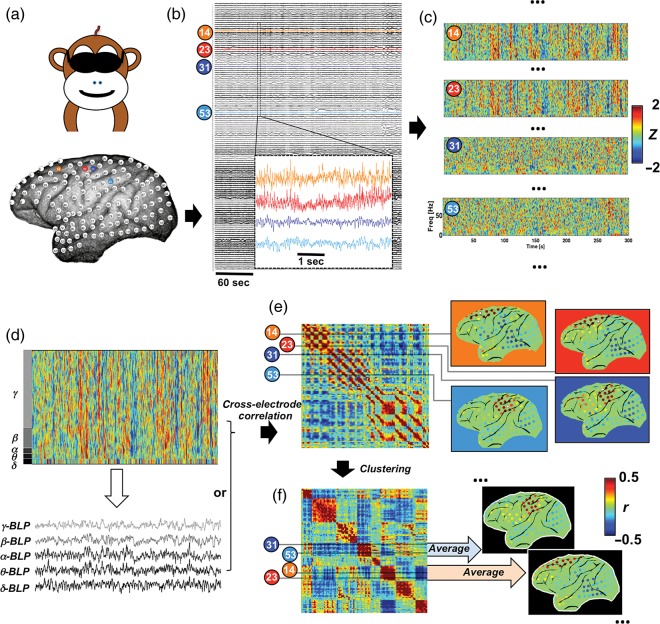
Figure 1.
Analysis flow illustrated with data from a representative session. (a) Spatial topography of 128 electrodes in monkey S with 4 exemplary ones (14, 23, 31, and 53) marked in color; (b) raw ECoG signals acquired during a 5-min eyes-closed session with an enlarged 5-s segment for the exemplary electrodes; (c) preprocessed spectrograms of the exemplary electrodes suggest relationship not simply explained by volume conduction effect: distant pairs (14 versus 23, and 31 versus 53) show similar spectrograms whereas the adjacent pair (23 versus 31) displays distinct patterns; (d) BLPs can be derived by averaging the spectrogram within specific frequency ranges; (e) cross-electrode correlations of the spectrogram or BLPs (β-BLP for the example here) form a matrix whose row (and column) values represent correlation values of specific electrode with all others (here called profile); map representation of correlation profiles of the exemplary electrodes (white stars) suggests 2 covariation structures whose boundary lies between the electrodes 23 and 31; (f) clustering electrodes based on the similarity of their correlation profiles and then reordering the matrix accordingly reveal several diagonal blocks that correspond to different covariation structures, whose topographic distribution and correlation strength can be then represented with group-averaged correlation maps.

