Figure 2.
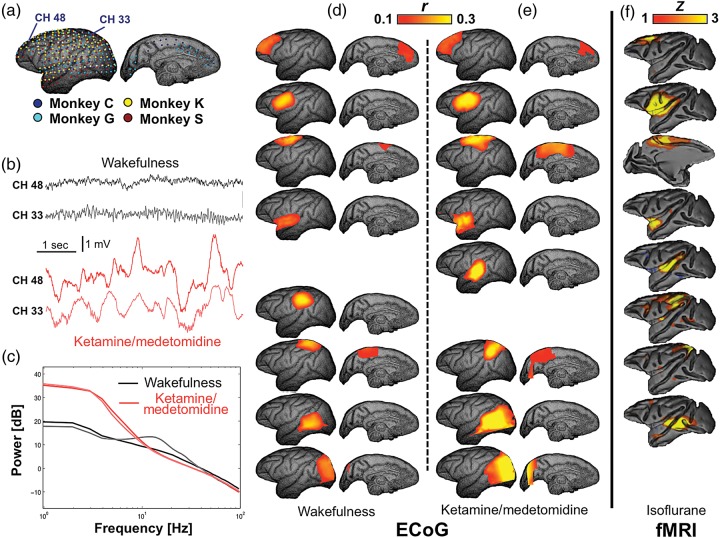
Spatial patterns of broadband ECoG power covariation. (a) Spatial topography of electrode coverage in individual monkeys is presented on cortical surface rendering reconstructed from the anatomical MRI of Monkey G. Exemplary ECoG raw signals from 2 electrodes in the Monkey C underwent a dramatic transition from a high-frequency, low-amplitude voltage pattern during eyes-closed wakefulness to a low-frequency, high-amplitude one under ketamine/medetomidine anesthesia (b), which is confirmed by distinct power spectra under these 2 conditions (c). However, correlation patterns of broadband ECoG power during (d) the eyes-closed wakefulness and (e) ketamine/medetomidine anesthesia similarly resemble (f) the fMRI resting-state networks (RSNs) from isoflurane-anesthetized macaques (adapted from [Hutchison et al. 2011]). Corresponding patterns or RSNs are aligned in the same row.

