Figure 2.

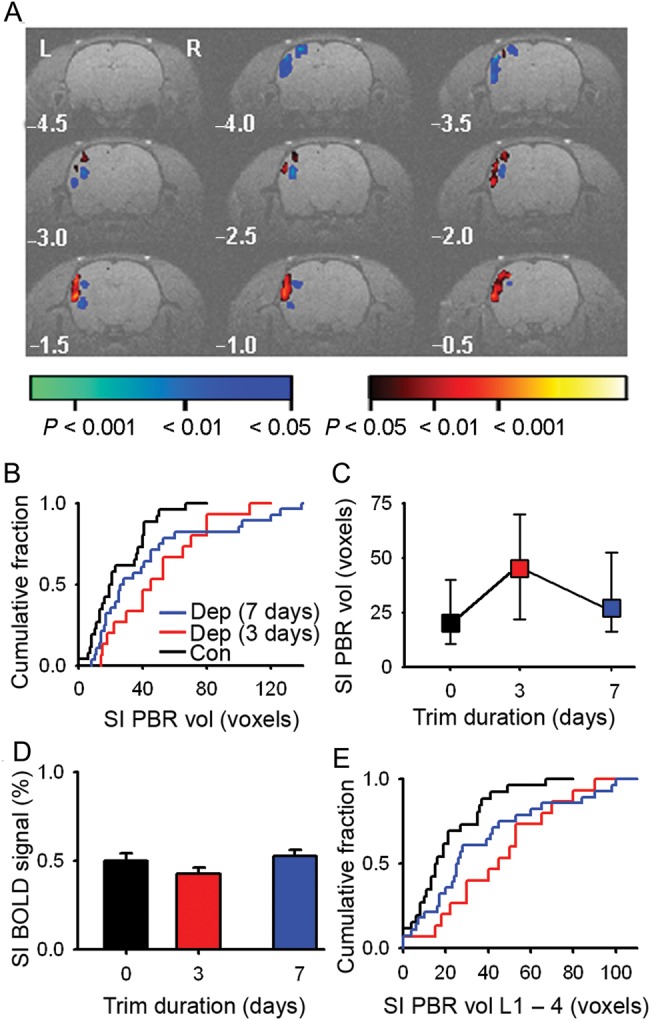
SI whisker representation expands without an increase in BOLD signal amplitude. (A) Single-animal statistical parametric map of the BOLD signal evoked by 5 Hz deflection of the right C1–4 whiskers after 3 days of whisker trimming. (B) Cumulative fraction plot of SI PBR volume from single-animal maps for controls (black, n = 26 rats), 3-day trim (red, n = 15 rats), and 7-day trim (blue, n = 28 rats). (C) Median SI PBR volume and interquartile range (error bars) after 3 and 7 days of whisker trimming (median SI PBR volume: controls, 20 [11–40] voxels, n = 26 rats; 3-day trim, 45 [24–69] voxels; n = 15 rats; 7-day trim, median volume, 26 [17–51] voxels, n = 28 rats). (D) Peak amplitude of BOLD signal (error bars, SEM) after whisker trimming (control, +0.50 ± 0.04%, n = 26 rats; 3-day trim, +0.43 ± 0.04%, n = 15 rats; 7-day trim, +0.53 ± 0.04%, n = 28 rats). (E) Cumulative fraction plot of the SI PBR volume in L1–4. Color code for (C–E) as (B).
