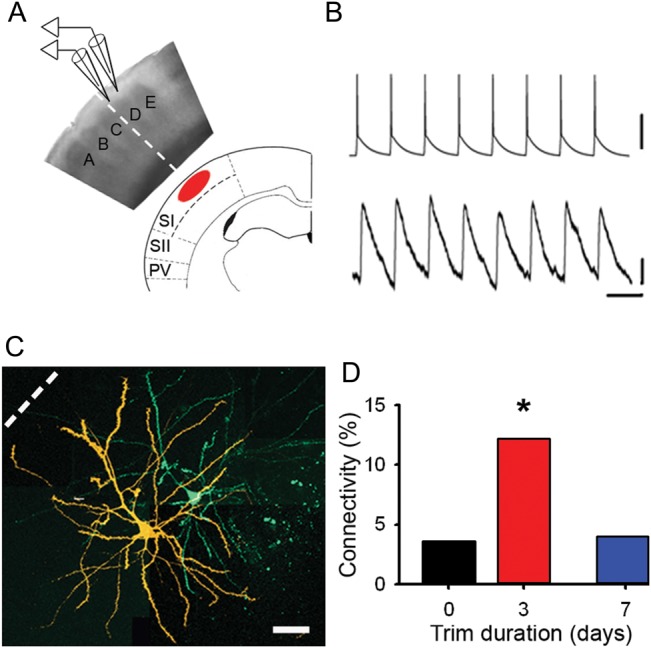
Figure 3.

Local excitatory connectivity changes in concert with BOLD whisker representations. (A) Schematic showing orientation of a brain slice with respect to BOLD fMRI images. Electrophysiological recordings were made in L2/3. Dashed line indicates the boundary between spared C-row whiskers and deprived cortex. (B) Synaptically connected pyramidal neurons. Upper trace, train of action potentials in presynaptic neuron. Lower trace, evoked response in postsynaptic neuron. Scale bars: 50 mV (upper), 0.1 mV (lower); 50 ms. (C) Confocal reconstruction of the presynaptic (green) and postsynaptic (orange) pyramidal neurons. Scale bar, 50 μm. (D) Connectivity between deprived L2/3 pyramidal neurons in controls (black, 3.6%), after whisker trimming for 2–4 days (red, 12.0%) and after whisker trimming for 6–8 days (blue, 4.0%).
