Figure 6.

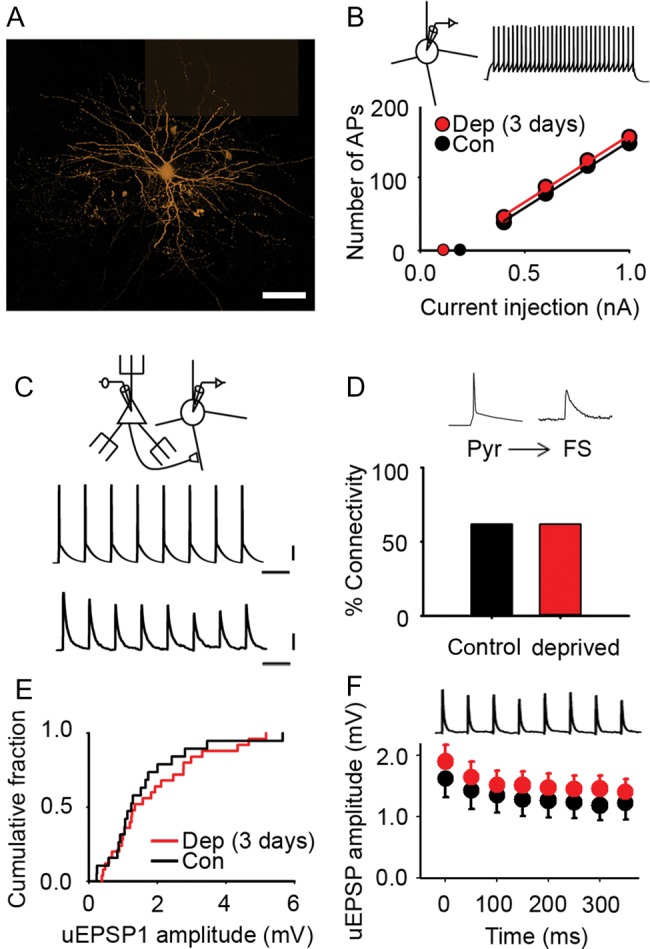
Excitatory transmission onto L2/3 FS interneurons in deprived cortex is not affected by brief sensory deprivation. (A) Montage of maximum intensity projections from confocal z-stacks of an L2/3 FS interneuron filled with AF568 (orange). Scale bar, 40 μm. (B) Mean number of action potentials recorded in L2/3 FS interneurons evoked by 500 ms depolarizing current pulses in control (black) and deprived (red) cortex after 2–3 days of sensory deprivation. Inset: example trace of action potentials in an L2/3 FS interneuron evoked by a +0.4-nA current pulse (500 ms). Slope of the input–output curve: deprived, 182 ± 9 action potential nA−1, n = 26 FS interneurons; control, 186 ± 10 AP nA−1, n = 32 FS interneurons. Rheobase: deprived, 0.11 ± 0.04 nA, n = 26 FS interneurons; control, 0.19 ± 0.03 nA, n = 32 FS interneurons. (C) Pyr → FS connection: 20 Hz train of action potentials in the presynaptic pyramidal neuron evokes short latency uEPSPs (average 50 trials) in the postsynaptic FS interneuron. Scale bars: 20 mV (top), 0.5 mV (bottom), 50 ms. (D) Percentage of pyramidal cell to FS interneuron pairs (Pyr → FS) that were synaptically connected in control (black, 62%) and deprived (red, 62%) cortex. (E) Empirical distribution plots of mean uEPSP1 amplitudes in deprived (red) and control (black) cortex. Median [IQR] of mean uEPSP1 amplitudes for Pyr → FS connections: deprived, 1.34 [0.93–2.76] mV, n = 25; control, 1.24 [0.88–2.00] mV; n = 19. (F) Mean uEPSP amplitude during 20 Hz trains in deprived (red, n = 25 Pyr → FS connections) and control (black, n = 19 Pyr → FS connections) cortex. Error bars, SEM.
