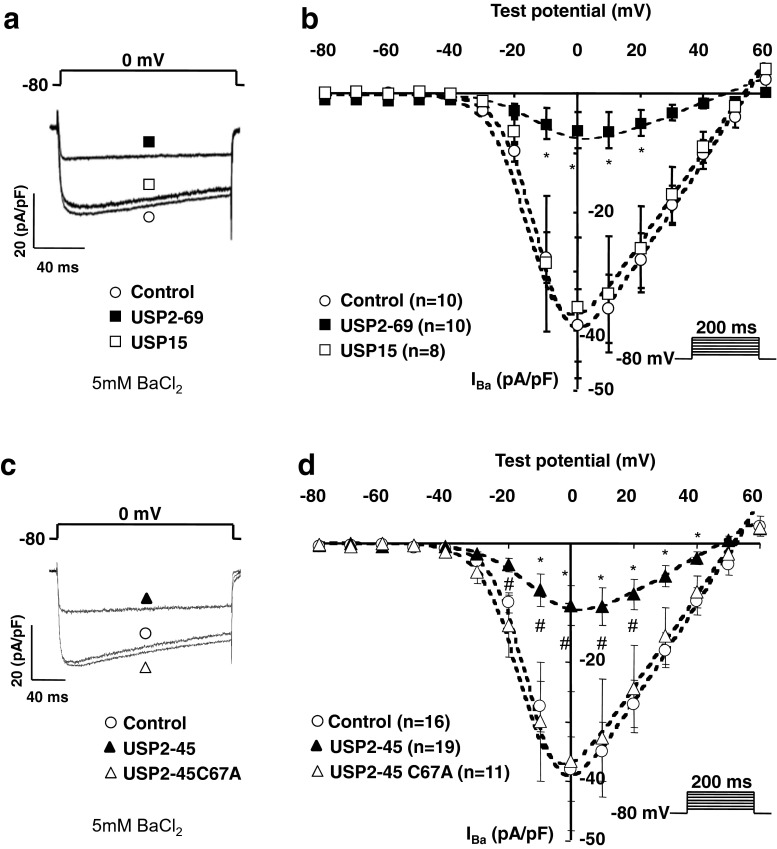
Fig. 1.
Effect of USP de-ubiquitylases on Cav1.2 currents. a Representative whole-cell current traces and b corresponding current-voltage (I-V) relationships in Cav1.2/β2/α2δ-1 channels transfected alone with control (white circle (control)), or with USP2-69 (black square) or USP15 (white square) in tsA-201 cells. The maximal conductance and reversal potential were calculated with the I-V fit described in ‘Methods’. G max was specifically decreased in USP2-69 (0.3 ± 0.2 nS/pF versus 0.8 ± 0.1 nS/pF in control; P < 0.05), but not in USP15-transfected cells (0.8 ± 0.2 nS/pF; NS versus control), whilst V rev was not modified by either USP2-69 (48 ± 3 mV versus 54 ± 3 mV in control; NS) or USP15 (46 ± 3 mV; NS versus control). The values for V 50,act and slope factors are indicated in the results section. One-way ANOVA statistical analysis compared control with USP2-69 or USP15 (*p < 0.05). The number of cells is indicated in parentheses. a Representative whole-cell current traces and b corresponding current-voltage relationships in tsA-201 cells transfected with Cav1.2/β2/α2δ-1 channels alone (white circle (control)), or with USP2-45 (black triangle) or the catalytically inactive mutant USP2-45 C67A (white triangle). G max was decreased by USP2-45 (0.4 ± 0.1 nS/pF versus 0.8 ± 0.1 nS/pF in control; P < 0.05), but not by USP2-45 C67A (0.8 ± 0.2 nS/pF; NS versus control), whilst V rev was not modified by either USP2-45 (44 ± 4 mV versus 54 ± 3 mV in control; NS) or USP2-45 C67A (52 ± 1 mV; NS versus control). The values for V 50,act and slope factors are indicated in the results section. One-way ANOVA statistical analysis compared control with USP2-45 (*p < 0.05) and USP2-45 C67A with USP2-45 (#p < 0.05). In all experiments, 5 mM BaCl2 was used to record Cav currents

