
Fig. 11.
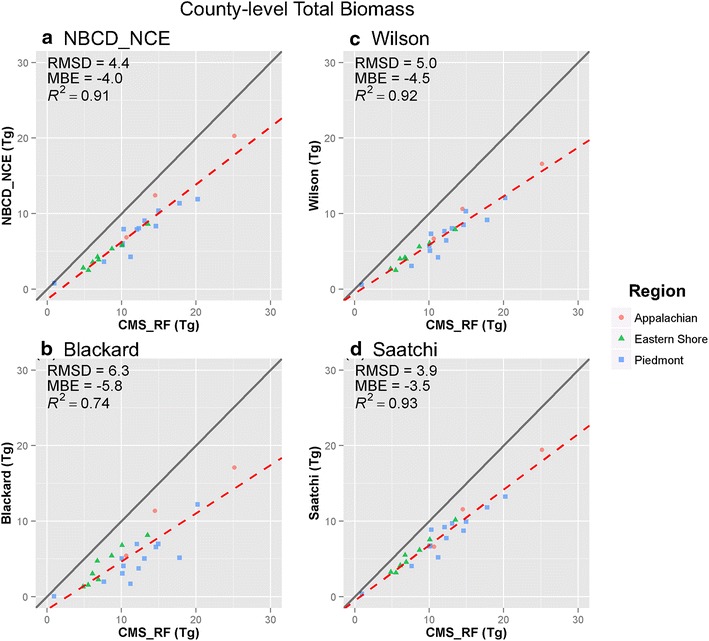
Scatter plots of county-level total biomass of four national products versus CMS_RF product. a NBCD_NCE at 30 m spatial resolution, b Blackard at 250 m spatial resolution, c Wilson at 250 m spatial resolution, and d Saatchi at 250 m spatial resolution. The x axis represents the values from represents biomass values from CMS_RF product and the y axis represents corresponding national products in each plot. Red dashed line is the fitted regression line, and gray solid line is the 1:1 line.