Fig. 13.

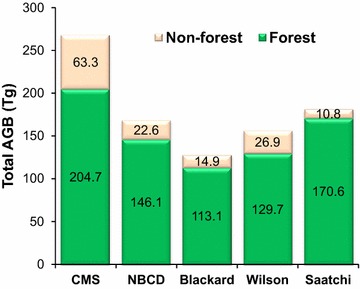
Comparison of total biomass at the state level from the CMS_RF map and the four national products over forested and non-forested areas. The forest/non-forest mask is aggregated from NLCD2006 with a threshold of 20 percentage.

Comparison of total biomass at the state level from the CMS_RF map and the four national products over forested and non-forested areas. The forest/non-forest mask is aggregated from NLCD2006 with a threshold of 20 percentage.