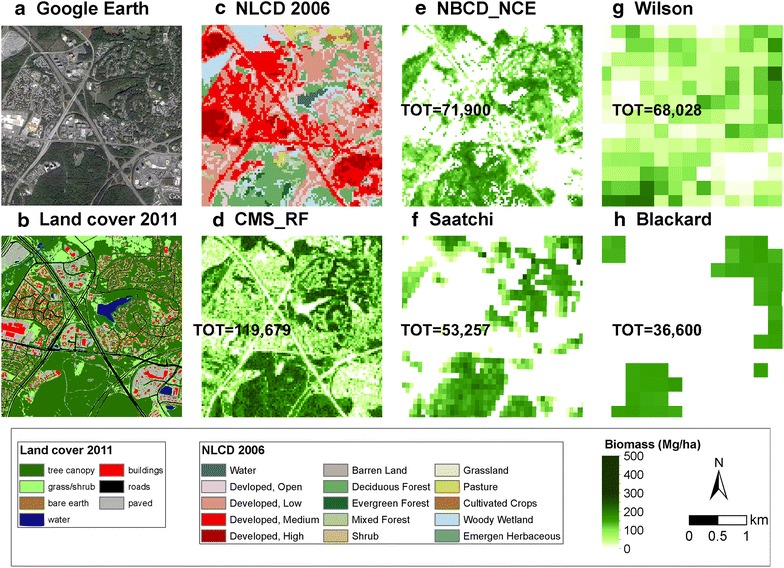
Fig. 3.

Discrepancies in spatial distribution of biomass density at fine-scale. a Google Earth image in 2012; b high resolution [1 m] land cover map; c NLCD2006; d CMS_RF biomass product at 30 m spatial resolution; e NBCD_NCE biomass product at 30 m spatial resolution; f Saatchi biomass product at 100 m spatial resolution; g Wilson biomass product at 250 m spatial resolution; and h Blackard biomass product at 250 m spatial resolution. Zoom-in figures are for Frederick County.
