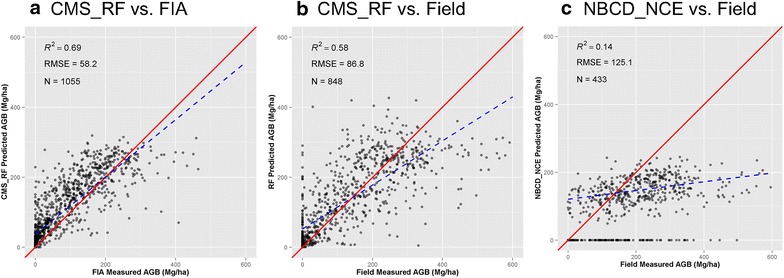
Fig. 7.

Scatter plots of CMS_RF and NBCD_NCE biomass products against FIA plots and CMS field plots. a CMS_RF vs. FIA, b CMS_RF vs. Field, and c NBCD_NCE vs. Field. The red solid line is the 1:1 line. The blue dashed line is the fitted regression with the filtered dataset, which exclude zero biomass in NBCD_NCE data. R2 and RMSD are calculated based on the filtered dataset.
