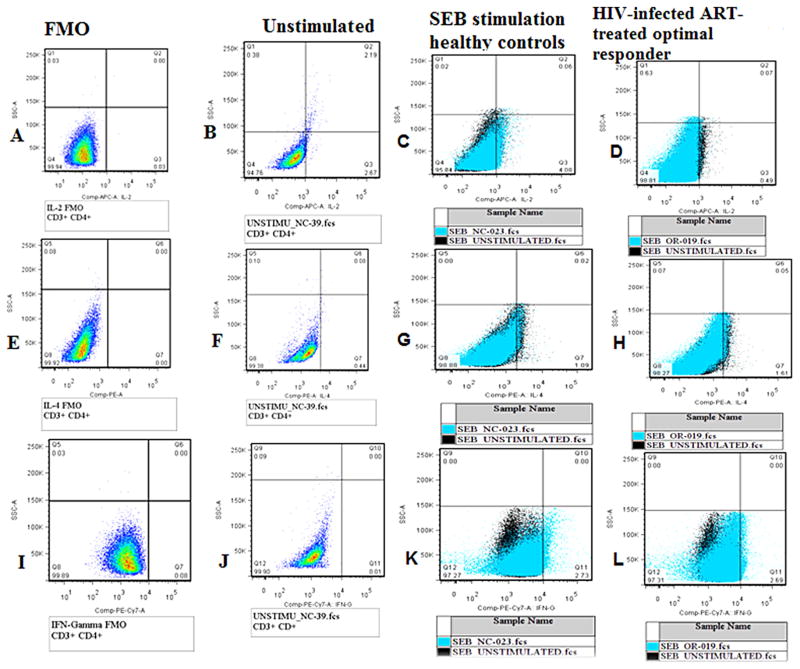
Fig. 3.
Gating strategy cytokine production. (A–D) IL2 production (A – FMO, B – unstimulated, C – healthy control and D – ART-treated optimal immune responder(O-IR)), (E–H) IL4 production (E – FMO, F – unstimulated, G – healthy control and H – ART-treated optimal immune responder), (I–L) interferon gamma production (I – FMO, J – unstimulated, K – healthy control and L – ART-treated optimal immune responder). Analysis of cytokine production IL-2, IL-4 and IFN-gamma was determined after subtraction of the background (unstimulated sample – black color) from the stimulated sample (blue color) as shown in C, D, G, H, K, and L.

