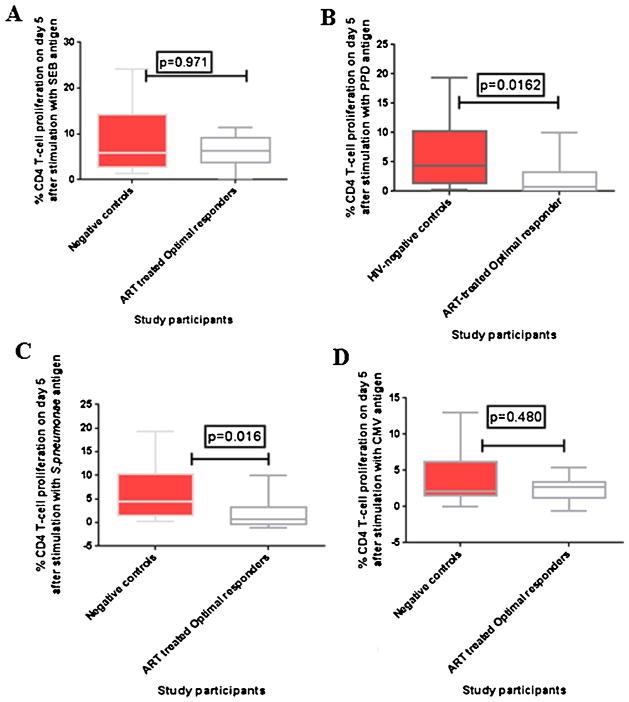
Fig. 4.
CD4 T-cell proliferation among ART-treated optimal responders and age-matched healthy HIV-negative adults, on day 5 of stimulation. (A–D) Percentages of proliferated CD4 T-cells on day 5 after stimulation with SEB, PPD, pneumococcal polysaccharide and CMV antigens respectively. The boxes and whiskers represent medians, 5th and 95th percentiles. The Mann–Whitney U-test for non-parametric tests was used to compare ART-treated optimal responders and healthy controls, with statistical significance at p values ≤ 0.05.

