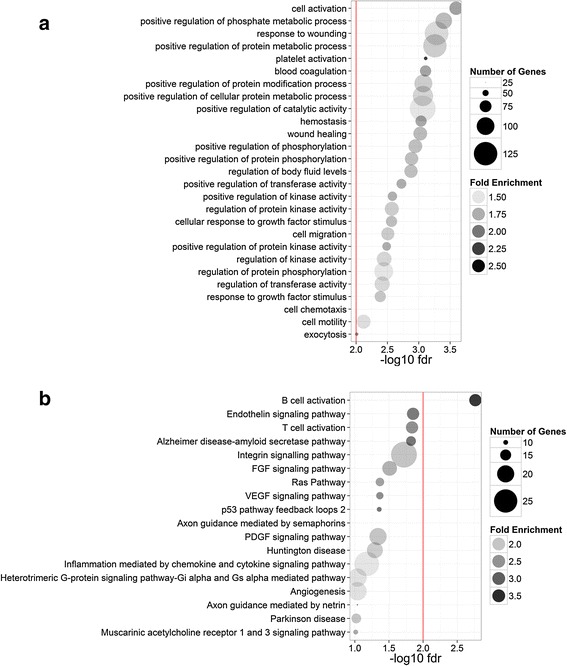
Fig. 3.

Enriched functional annotations among differential H3K27ac loci. Proximal gene enrichments for differential H3K27ac loci were analyzed using a GO biological processes; and b PANTHER pathways. Circle size is proportional to the number of identified genes. Circle transparency is proportional to fold enrichment relative to the human genome. Functional annotations were ordered by FDR derived from hypergeometric test. Red vertical lines indicate the cutoff at 5 % FDR. GO: gene ontology; FDR: false discovery rate
