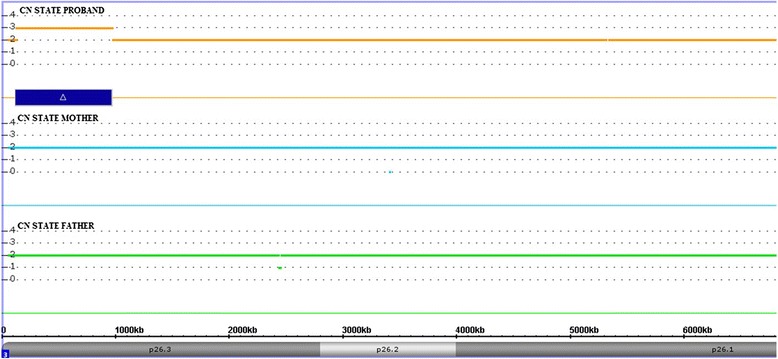
Fig. 2.

Chromosome microarray analysis performed with the Affymetrix CytoScan HD array and visualized using the Affymetrix Chromosome Analysis Suite version 3.0. Copy number state of each probe is drawn along chromosome 3 from 1 to 6.800.000 bp. The upper panel represents the copy number state of the proband, the middle panel the mother and the lower panel the father. Values of Y-axis indicate the inferred copy number according to probe intensities. Blue bar is the duplicated region identified in the patient
