
Fig. 5.
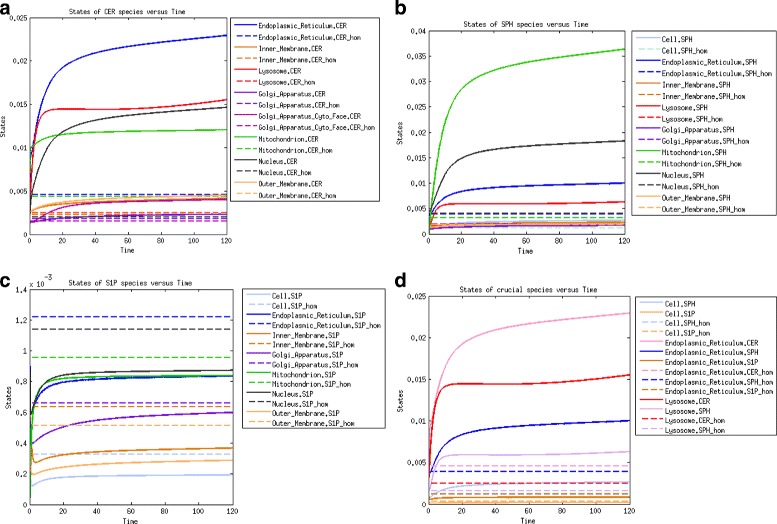
Time evolution of molar concentrations of the following species (the dashed lines correspond to the homeostasis scenario and solid lines to the AD scenario): (a) ceramide species; (b) sphingosine species; (c) sphingosine-1-phosphate species; (d) species functionally related to AD