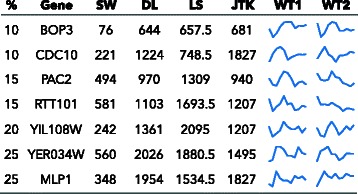
Fig. 7.

Examples of genes from the yeast cell cycle data in the top 10 % of SW, not in the top % listed (first column) of other algorithms, filtered for noise, that overlap with other data sets and have not been identified in [11] and/or [18]. Columns are gene symbols; the rank out of 5,900 probes for each method; and the plot of the wild-type replicates 1 and 2. Ties in rank are averaged. The plots are normalized from the minimum to the maximum. For a full listing of genes in the top 10 % of one algorithm but not in the top 10 % the others, see supplemental files “top_genes”
