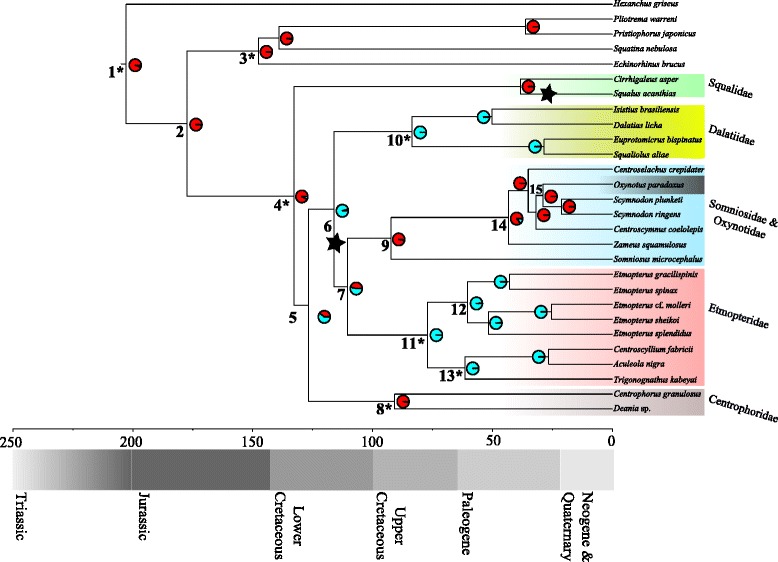
Fig. 2.

Chronogram resulting from the BEAST [38] analysis with estimated shift in the diversification rate. Background rate r = 0.02. The black stars indicate significant increase in the diversification rate to r = 0.15 (radiation Squalidae) and r = 0.05 (Etmopteridae, Oxynotidae and Somniosidae) estimated with MEDUSA [39, 40]. Scale bar in millions of years. Numbers at branches refer to node numbers given in Table 1. Pie charts indicate the probability that ancestral taxa are luminescent (blue) or not (red). Families Etmopteridae and Dalatiidae were coded as luminous as well as the genus Zameus within Somniosidae. * = Node calibrated with information from the fossil record (Table 2)
