
Fig. 6.
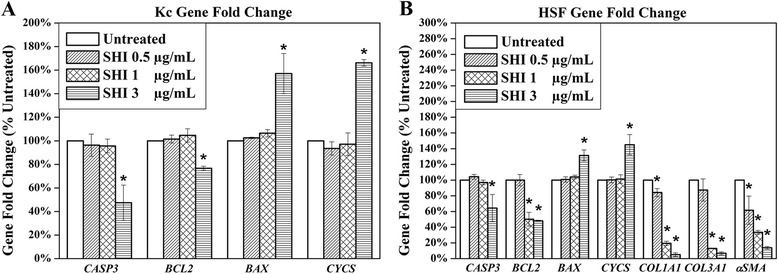
Effects of SHI on cell gene expression. a Gene Expression in Kc; b Gene expression in HSF. Kc and HSF were treated with various concentrations of SHI for 24 h and then total RNA was collected. After RNA extraction, first strand cDNA was synthesized. The cDNA sample was then amplified using qRT-PCR. The expression of the target gene was first normalized to GAPDH and then further converted to the percentage of the untreated control. Error bars indicate mean +/− SEM (n = 3). *p < 0.05 versus the untreated control. Statistical analysis was performed using One-way ANOVA and Tukey’s post-hoc test