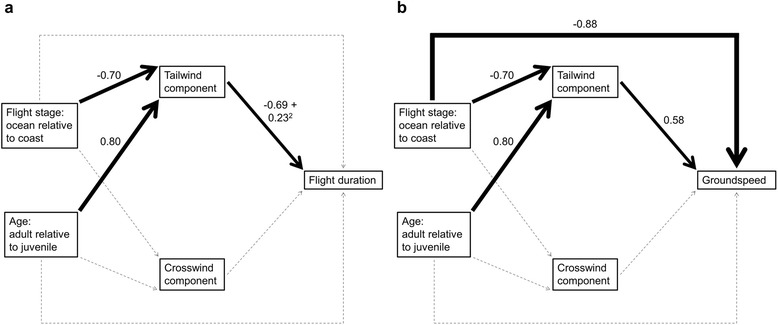
Fig. 3.

Path diagrams showing factors affecting a flight duration and b groundspeed. Path models represent the most parsimonious models from our AICc model selection procedure (Tables 1 and 2). Light grey hatched lines represent paths for uninformative parameter estimates and black lines represent paths for informative parameter estimates. For the latter, each line is scaled in width relative to the standardized path coefficient located above each line
