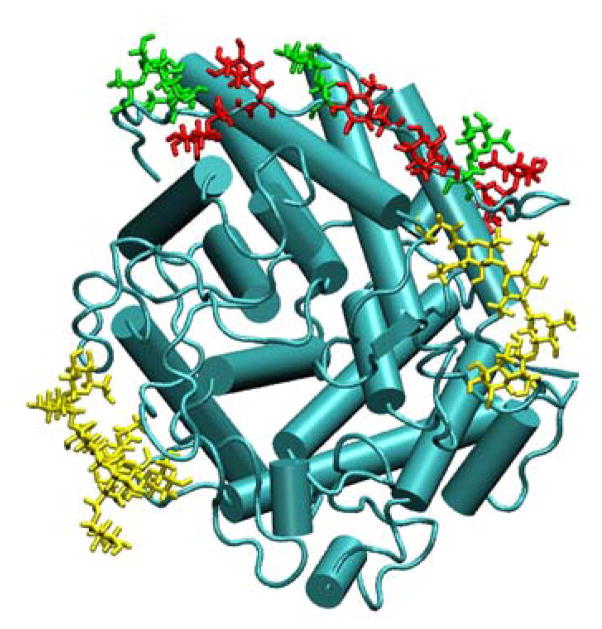
Figure 3.
Structure of glucoamylase from Aspergillus awamori var. X100 (PDB id: 3GLY). The protein is shown as a cartoon drawing in cyan. The Ser-O-linked monosaccharides are shown as licorice drawing in red, while the Thr-O-linked monosaccharides are shown in green. The N-linked polysaccharides are shown as licorice drawing in yellow. The figure was prepared using VMD. [69]

