
Figure 5.
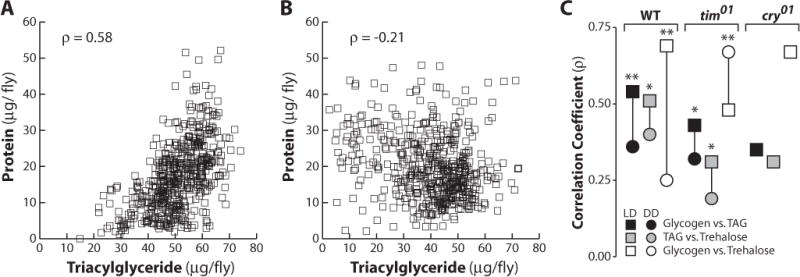
Metabolic levels are coordinated in individual flies under 12:12 LD environmental conditions. (A) Scatter plot showing glycogen and protein concentrations in individual wild-type flies (n > 540) entrained under 12:12 LD conditions. Correlation was determined using Spearman r. (B) Scatter plot showing glycogen and protein concentrations during the second day of DD following entrainment at 12:12 LD (n > 540). (C) Plot depicting changes in Spearman correlation coefficients from LD (circle) to DD (square) conditions, comparing glycogen to triacylglycerol (TAG) (black), trehalose to TAG (gray), or trehalose to glycogen (white) in wild-type, tim01, or cry01 mutants (*p < 0.01, **p < 0.001, Fisher z transformation). See Supplementary Figure S2 for primary data.