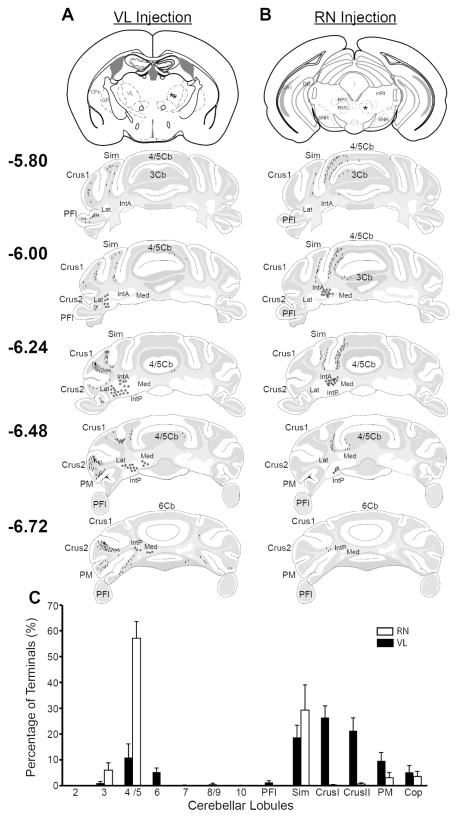
Figure 4.
Atlas sections showing location of nucleocortical collateral terminals labeled in the cerebellar cortex following ventrolateral (VL) and red nucleus (RN) injections which were then quantified. A. (top) Atlas section shows BDA injection site (asterisks) into VL. (lower)Atlas sections show the location of terminals (tick marks) and somata (stars) following the injection shown above. B. (top) Atlas section shows viral injection site (asterisk) into the RN of an Ntsr1-cre mouse. (lower) Same convention as in A. C. The percentage of terminals counted in each cerebellar lobule was averaged across animals for VL (black bars; n=11) and RN (white bars; n=9) injections and plotted as mean ± sem. Abbrv: Cop - copula of the pyramis; PM - paramedian lobule; Crus I - crus 1 of the ansiform lobule; Crus II - crus 2 of the ansiform lobule; Sim - simple lobule; PFl – paraflocculus.

