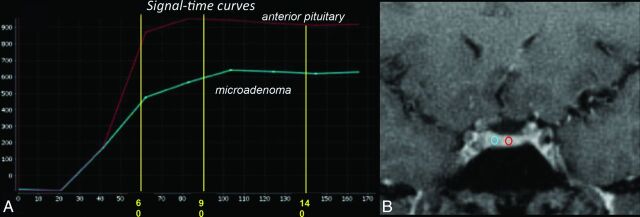
Fig 3.
A, GRASP image demonstrates placement of ROIs within the normal-appearing pituitary gland and microadenoma. B, Corresponding signal-time curves are shown. Peak enhancement from the anterior pituitary gland is seen at approximately 80 seconds with subsequent gradual washout. Peak enhancement from the microadenoma is seen at approximately 100 seconds with a subsequent plateau. There is a significant difference in the enhancement between the anterior pituitary gland and the microadenoma from 60 seconds onward.

