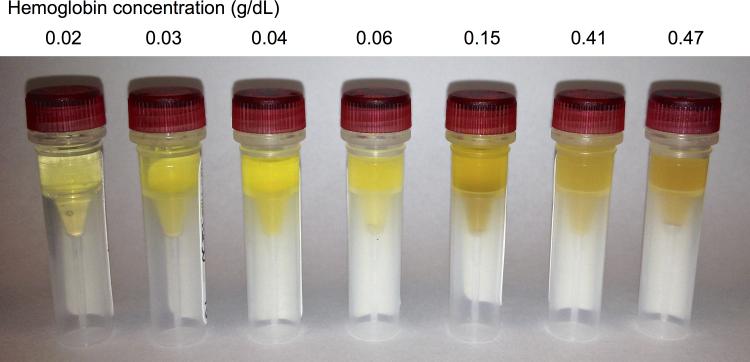
Figure 4.
A range of subtle visual differences in red blood cell hemolysis in seven representative serum samples acquired from patients with sepsis. Samples are ordered from left to right in ascending order of free hemoglobin (Hgb) levels acquired from each sample, which reflects over a 20-fold difference in Hgb concentration.

