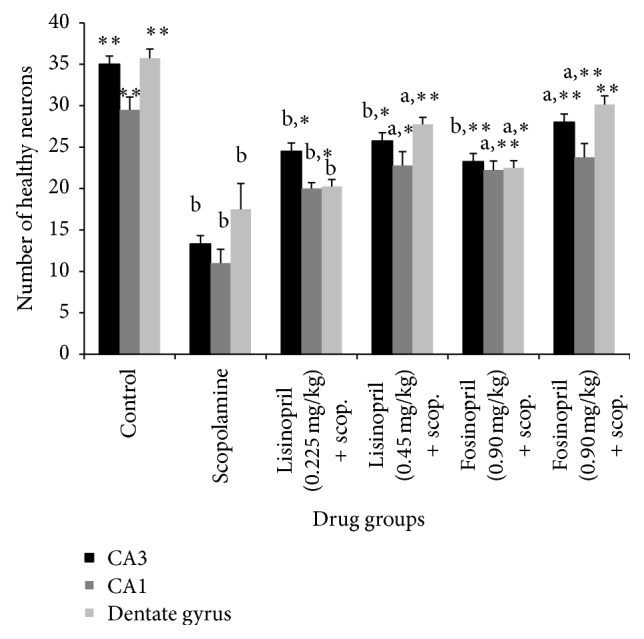
Figure 6.

Number of healthy neurons at CA3, CA1, and dentate gyrus regions of the hippocampus of scopolamine treated amnesic rats following treatment with lisinopril and fosinopril. Comparison between control, scopolamine, lisinopril, and fosinopril treated groups in the probe trial of Morris water maze test in which no platform was present. Values are mean ± SE, ∗versus scopolamine (p < 0.05), ∗∗versus scopolamine (p < 0.001), aversus control (p < 0.05), and bversus control (p < 0.001).
