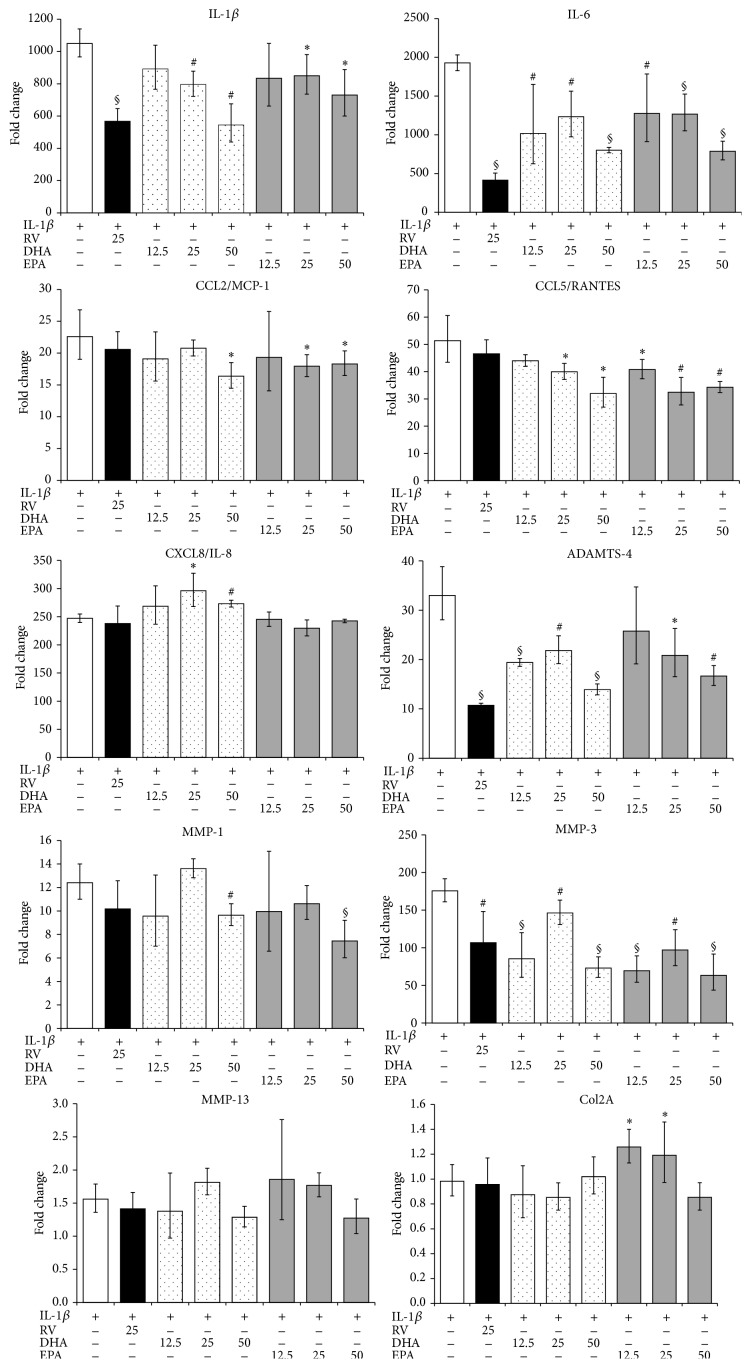
Figure 4.
Modulation of gene expression in IL-1β activated human chondrocytes. Cells were activated with IL-1β with or without the indicated substances for 4 h. Gene expression was quantified by RT-PCR and the data expressed as fold change compared to levels observed in unstimulated cells. ∗ p < 0.05, # p < 0.01, and § p < 0.001 (IL-1β only versus IL-1β + substance).

