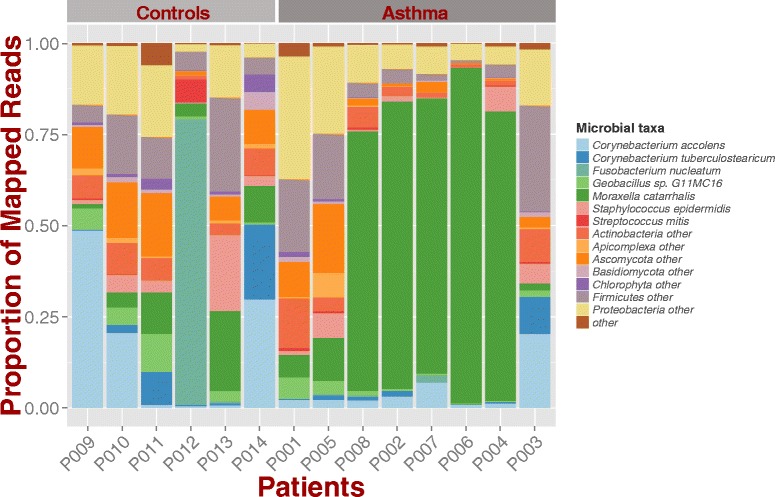
Fig. 2.

Microbial composition of asthma and control samples. Stacked bar chart shows different composition among groups with Moraxella catarrhalis dominating 5 out of 8 asthma samples. Since samples are RNA, the proportion of mapped reads represents the confounded variable of microbe presence and microbial gene expression
