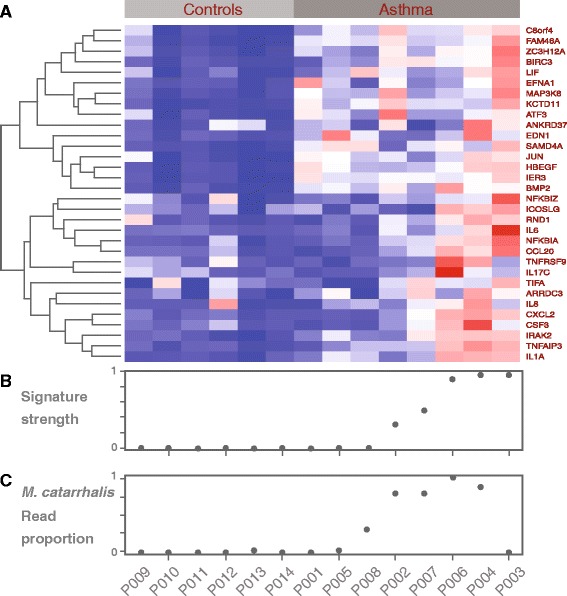
Fig. 4.

a Heatmap of Moraxella catarrhalis signature genes distinguishes the asthma samples from the controls. The color scale goes from blue (low expression) to red (high expression). b, c The Moraxella catarrhalis signature strengths are highly concordant with the PathoScope read proportions in control and asthma samples with the exception of sample P003
