Abstract
The measurement of pulmonary perfusion (blood delivered to the capillary bed within a voxel) using arterial spin labeling (ASL) magnetic resonance imaging (MRI) is often complicated by signal artifacts from conduit vessels that carry blood destined for voxels at a distant location in the lung. One approach to dealing with conduit vessel contributions involves the application of an absolute threshold on the ASL signal. While useful for identifying a subset of the most dominant high signal conduit image features, signal thresholding cannot discriminate between perfusion and conduit vessel contributions at intermediate and low signal. As an alternative, this paper discusses a data driven statistical approach based on statistical clustering for characterizing and discriminating capillary-perfusion from conduit vessel contributions over the full signal spectrum. An ASL flow image is constructed from the difference between a pair of tagged MR images. However, when viewed as bi-variate projection that treats the image pair as independent measures (rather than the univariate quantity that results from the subtraction of the two images), the signal associated with capillary-perfusion contributions is observed to cluster independently from signal associated with conduit vessel contributions. Analyzing the observed clusters using a Gaussian mixture model makes it possible to discriminate between conduit vessel and capillary-perfusion dominated signal contributions over the full signal spectrum of the ASL image. As a demonstration of feasibility, this study compares the proposed clustering approach to the standard absolute signal threshold strategy in a small number of test images.
Keywords: arterial spin labeling, pulmonary blood flow, feature segmentation, statistical clustering, image processing, lognormal statistics, Gaussian mixture model
Graphical Abstract
A statistical clustering approach was used to discriminate perfusion from conduit vessel signal contributions in an ASL MR image of pulmonary blood flow. Previous studies use an absolute signal threshold discrimination strategy designed to identify signal from the most dominant conduit vessels contributions. The statistical clustering approach has the advantage that it makes it possible to discriminate between conduit vessel and perfusion signal contributions over the full signal spectrum of an ASL MR image.
I. Introduction
In arterial spin labeling (ASL) magnetic resonance imaging, magnetically tagged blood water is used as a non-invasive endogenous tracer to produce a spatial flow map. Predominantly used to measure blood flow in the brain (1), ASL has recently been adapted for the investigation of pulmonary perfusion under various conditions (2–11). Throughout this paper, the term perfusion is used to signify blood destined for capillary vessels within a voxel. While the specific protocol details may vary, conceptually speaking ASL imaging involves two measurements designed to measure flow into a selected image region. In these measurements the magnetization of the delivered pulmonary arterial blood is prepared so that it is fully relaxed in one measurement (the control image) and recovering from an inversion pulse in the other measurement (the tag image), with the static spins within the image region generating the same signal in each measurement. In practice, because of the inversion times used, the blood is bright in the control image but dark in the tag image, and they are often loosely described as blood “bright” and blood “dark” images. Subtracting the dark image from the bright removes the static background to isolate the flow during a cardiac cycle.
In assessing perfusion using an ASL image, it is important to recognize that, in addition to perfusion (blood flow at the level of local pulmonary capillaries for the purpose of gas exchange), the signal also reflects contributions from blood transiting through conduit vessels that does not perfuse local capillaries. In contrast to the brain, where conduit vessels tend to run peripherally to the tissue of interest, conduit vessels are present throughout the lung (figuring most prominently near the hilum) and their presence is known to lead to systematic bias in global perfusion metrics such as relative dispersion (8, 9). Thus, one of the main challenges in characterizing pulmonary perfusion is distinguishing perfusion from conduit flow.
Based on observations that suggest that image features exhibiting the highest signal tend to be dominated by contributions from conduit vessels, one strategy for dealing with conduit signal contributions involves the application of an upper signal threshold to exclude image features that exhibit the strongest ASL signal (7, 8). While this simple approach is useful for identifying a subset of the most dominant (i.e. high signal) conduit vessel image features, it does not address signal contributions from conduit vessels exhibiting intermediate and low ASL signal.
As an alternative, this paper explores a statistical clustering method for independently characterizing perfusion and conduit flow contributions over the full signal spectrum. The clustering approach is motivated by the observation that conduit flow and perfusion signal contributions cluster independently. This interesting observation may not be entirely surprising as rapid flow through conduit vessels can lead to a complete turnover in volume resulting in signal saturation effects (1, 2, 12) that have the potential to alter the statistical properties of conduit signal contributions.
To facilitate the analysis, the signal statistics are analyzed over a bi-variate projection that treats the dark/bright image pair as independent measures. While this is more complicated than subtracting the bright and dark images and applying a threshold, analyzing the signal statistics over a bi-variate projection that maximizes the available information improves the ability to resolve the perfusion signal cluster from the conduit signal cluster. The cluster statistics of the ASL image pair are characterized using a bi-component Gaussian mixture model that is optimized to the data (13–15). The optimization results can then be used to discriminate between conduit flow and perfusion dominated contributions based on Bayesian posterior probability.
As a demonstration of an area where the statistical clustering approach may offer a potential improvement over the standard signal threshold method, a cluster based approach to image segmentation is used to identify the distribution of conduit vessel image features in a series of ASL images from 5 healthy subjects. The results are compared to the signal threshold approach.
II. Methods
A. Subject population
The data used in this example data set were taken from a prior study (11) and full details are given there. In brief, we studied five healthy young male subjects aged 22 to 35 years (mean age 29 ± 5; height 179 ± 5 cm; weight 76 ± 8 kg). All subjects were lifelong non-smokers, had normal lung function (FEV1 % pred 90 ± 12), with no history of pulmonary or cardiovascular disease. Prior to imaging, subjects were screened using a safety questionnaire to ensure that there were no contra-indications to MRI scanning. The UCSD Human Research Protection Program approved the study, and subjects provided written informed consent prior to participation.
B. Overview of the ASL protocol
The ASL protocol used two images, one collected after a slice-selective inversion pulse (blood bright), and one after a non-selective inversion pulse (blood dark). The arterial blood delivered to the slice during the delay (inversion time) between inversion and image acquisition is then fully relaxed in the blood bright image, and recovering from an inversion in the blood dark image. In addition, a saturation pulse is applied to the slice after each inversion, so that in both images the static signal component is recovering from a saturation pulse. By removing the static features common to both images, subtraction is then expected to isolate the flow into the image slice during a cardiac cycle. Because the timing is the same for the acquisition of the bright and dark images any T1 effects are common to both images. and signal values are always positive. The technique is fully described in (2).
Thus, the ASL protocol involves a pair of images with the composite ASL difference signal interpreted as a proxy for blood flow. Henceforth, D, B, and Z ≡ B–D shall denote continuous variables that represent dark, bright, and difference signal values, respectively. Conceptually, flow is a positive quantity, Z ≥ 0. While ideally one expects the difference signal to be everywhere positive, in practice, it is observed that Z < 0 for a subset of voxels. Voxels for which Z < 0 are assumed to reflect noise (as might arise from registration mismatch, electronic noise, and other sources).
C. Set-up and Image acquisition
All images were collected with a General Electric 1.5 Tesla Excite MRI system using an 8-channel torso coil. Cardiac-gated bright and dark images of a single sagittal slice in the right lung were acquired with a slice thickness of 10 mm, square field of view of 40 cm, and a 256×128 matrix, giving a resolution element of approximately 1.5 mm×3 mm×10 mm (45 mm3 or 0.05 cm3). We used a 2-dimensional ASL-FAIRER sequence (2, 16) with a half-Fourier acquisition single-shot turbo spin-echo (HASTE) imaging scheme with a readout window of 300 ms. To ensure that the imaging sequence is complete during diastole, the inversion time was chosen to be 80% of the cardiac RR interval. An interval of about 5 seconds was provided between measurements to accommodate a comfortable breathing rate for voluntary respiration gating during the image acquisitions.
The single ASL image pairs used in this study were selected at random from among a time-sequential series of ASL image pairs acquired as part of the temporal imaging study described in Ref. (11). For the slice selective inversion pulse, the width of the inversion band was 15mm greater than the slice thickness. Images were acquired in a single sagittal slice of the right lung at a lateral position where the anterior-posterior dimension of the lung was approximately maximal. The two images were registered based on the outline of the lung (see Ref. (11) for details), and masked to leave only the lung field. The bright and dark images were then subtracted on a voxel by voxel basis to create the ASL image.
Our eventual intention is to adapt the clustering approach to investigate temporal dynamics which requires rapid sampling and analysis. For this reason we have focused our efforts on the analysis of individual ASL image pairs. While averaging multiple images may potentially improve SNR and reliability, we do not discuss it here.
D. The statistical clustering approach
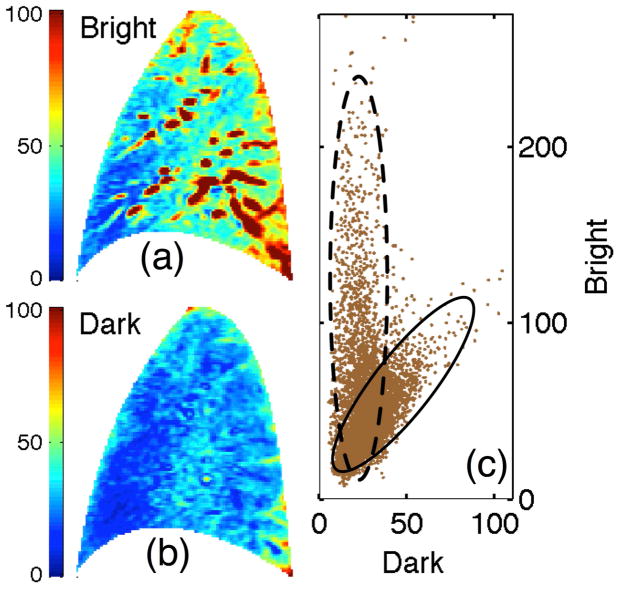
Through a demonstration involving the tag/control image pair shown in Fig. 1 this section outlines the proposed clustering approach for identifying and quantifying the statistical properties of perfusion image features in an ASL image.
Fig. 1.
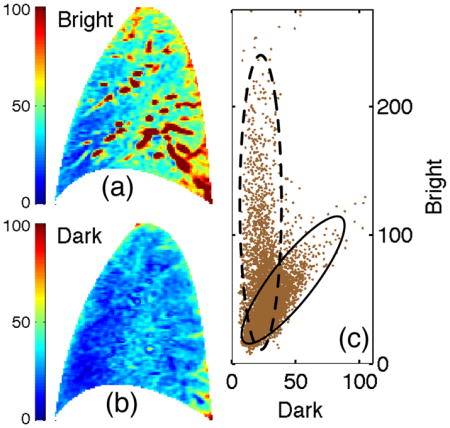
Bivariate representation of an ASL image. (a) Bright and (b) dark images along with (c) the ensemble of bivariate signal samples that comprise ASL image, i.e. values of bright vs dark image signal for each voxel, presented as a scatter plot. Solid and dashed ovals highlight the clusters. Color and axis scalings represent absolute signal values.
1) The bivariate distribution
For each sampled voxel, there are two associated observables; the dark and bright intensity signals shown in Fig. 1(a) and 1(b). Figure 1(c) presents a bivariate scatter plot of the two element vector, Xn = [Dn, Bn] where Dn and Bn are the dark and bright intensity values for voxel n and N represents the total number of voxels in the image. The resulting bimodal pattern suggests the bivariate ASL representation comprises two statistically distinct components or clusters. To analyze the clusters, we optimized the bi-component statistical mixture model developed in Appendix A with respect to the observed bivariate distribution presented in Fig. 1 under the following assumptions:
Each bivariate (dark and bright) voxel signal results from a combination of signal contributions from stationary anatomic structure, perfusion, and flow through conduit vessels
Any anatomic contributions are assumed to be perfectly correlated – i.e. that they contribute equally to the bright and dark signals
Contributions from perfusion and flow through conduit vessels cluster independently
All statistics are lognormal
The optimization results are shown in Fig. 2. Panel (a) presents a 2-dimensional histogram, Pobs = Pobs(D, B), generated from the scatter plot presented in Fig. 1(c). To facilitate the discussion Pobs has been normalized according to the relation ∫∫dDdB Pobs = 1 so that it represents an observational estimate of the probability density function (PDF). Panel (b) presents the optimal fit (denoted as Pfit) to Pobs. The fit comprises a superposition, Pfit ≡ C1 + C2, of two log normal components shown in panels (c) and (d). Component 1 is interpreted as the distribution describing the aggregate statistics of perfusion signal contributions. Likewise, component 2 is interpreted as the distribution describing the aggregate statistics of conduit signal contributions. Consequently, components 1 and 2 are interchangeably referred to below as the perfusion and conduit components, respectively.
Fig. 2.
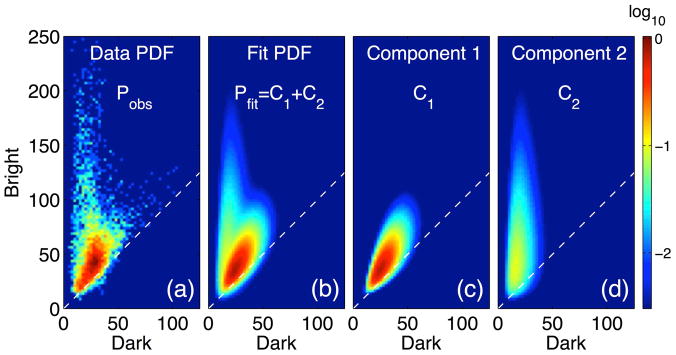
Mixture model solution. (a) Observed probability density function (PDF, a normalized 2-D histogram), Pobs, generated from the observed bivariate scatter plot representation in Fig. 1(c). Panel (b) presents the optimal fit, Pfit, to the observed PDF which can be decomposed into two components: (c) one identified with perfusion signal and (d) another identified with conduit signal. Color scale indicating PDF values is normalized and presented in log scale to facilitate viewing. Dashed lines indicate the contour of zero ASL difference signal (Z = 0).
E. Application to conduit vessel image segmentation
This section outlines a statistical clustering approach to segmentation that identifies conduit vessel dominated image features in an ASL image. To highlight the strengths of the clustering approach it is compared with the signal threshold strategy.
1) Signal threshold segmentation
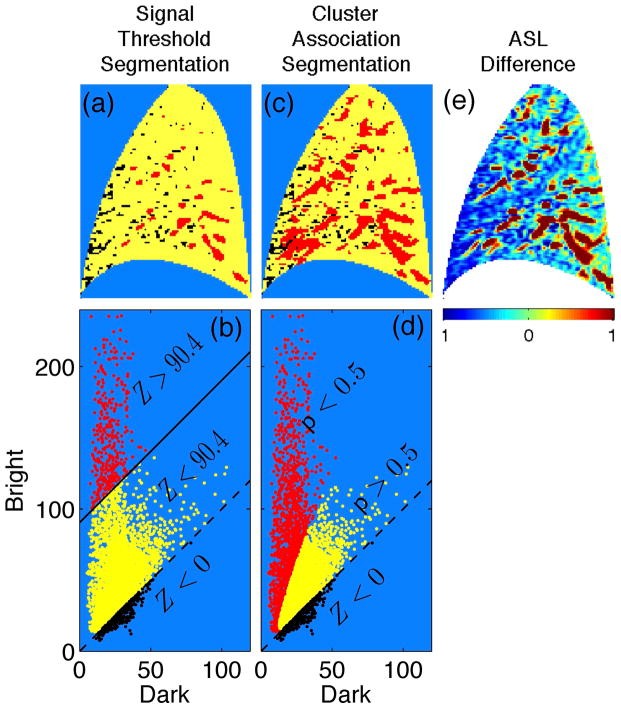
Based on the premise that image features exhibiting the highest signal tend to be dominated by contributions from conduit vessels, the signal threshold strategy identifies features exhibiting signal above a chosen threshold as conduit signal dominated (12). One strategy for setting the threshold value, based on in-silico modeling, is to set it at 35% of the maximum signal value observed in the image (12). For the ASL difference image presented in Fig. 3, this threshold value is Z = 90.4. Panel (a) presents the signal threshold segmentation. Image features exhibiting signal above threshold (Z > 90.4, red) are identified as the most dominant conduit signal contributions while features exhibiting signal below threshold (Z = 90.4, yellow) represent the collection of voxels where the main signal contributions arise from perfusion and/or intermediate/weak conduit flow. Voxels whose difference signal is negative (Z < 0) are indicated in black, and are considered noise. Panel (b) identifies the same voxels in the bi-variate scatter plot representation, highlighting the portion of the distribution that falls above the signal threshold contour, Z = 90.4. While this approach can be useful for identifying the most dominant conduit vessel image features, it cannot identify voxel samples whose signal is influenced by intermediate and weak conduit signal contributions.
Fig. 3.
Image segmentation. In the signal threshold segmentation (a) and corresponding bright vs. dark scatter plot representation (b) the signal threshold is set according to the 35% criterion value, Z = 90.4 in this example. Voxel samples exhibiting difference signal above and below the threshold appear red and yellow, respectively, with the solid line indicating the Z = 90.4 contour. In the cluster association segmentation (c) and corresponding bright vs dark scatter plot representation (d), yellow and red indicate voxel samples exhibiting a posterior probability (with respect to the perfusion component) above and below p = 0.5, respectively. Dashed lines indicate the Z = 0 contour with voxel samples exhibiting a negative difference signal value indicated in black (all panels). (e) The corresponding ASL difference image (color represents variation about the image mean scaled in units of standard deviation) has been included for comparison.
2) Statistical cluster segmentation
By design the clustering approach characterizes two clusters of voxel signal samples exhibiting different statistical properties – a difference that can be exploited to segment the image according to association with one or the other of the clusters. This is achieved by assigning to each voxel a posterior probability (see Appendix), denoted as p (0 ≤ p ≤ 1), with respect to the perfusion component (component 1 from Fig. 2 (c)). As there are only two clusters, the posterior probability with respect to the conduit component (component 2 from Fig. 2 (d)) is given by 1 − p. In words, then, the posterior probability with respect to the perfusion component is the probability that a given voxel signal value “belongs” to the perfusion component and not the conduit vessel component. Panel (c) of Fig. 3 presents the cluster association segmentation result with p < 0.5 (red) and p > 0.5 (yellow) identifying image features dominated by conduit and perfusion contributions, respectively. Panel (d) identifies the same voxels in the bi-variate scatter plot representation, highlighting the portion of the distribution that falls below the p = 0.5 association criterion.
To help interpret this result, the ratio of perfusion signal to conduit signal in a given voxel is approximately proportional to the posterior probability for that voxel (on average). The interpretation, then, is that values of p < 0.5 indicate that conduit signal is more likely than perfusion to be the dominant signal contribution. Referring to panels (a) and (c), as compared to the signal threshold strategy, the cluster association approach identifies a larger footprint as conduit signal dominated. Specifically, the total footprint identified as conduit signal using cluster association covers 23% of the image versus 5% using the signal threshold strategy.
III. Results
As a demonstration of the cluster association segmentation approach, this section presents the results from a study of pulmonary ASL images from 5 subjects. As indicated above these images were taken from those collected as part of an unrelated study (11) and are simply used as a demonstration set.
Figure 4 presents segmentation results for each subject image. Image features identified as dominated by conduit signal using the statistical clustering segmentation exhibit a similar spatial distribution to features that exceed the signal threshold in the threshold segmentation. Notably, the statistical clustering result tends to capture a larger footprint – the total footprint identified as conduit signal using cluster association covers 21% of the subject images (as an average over the subject population) versus 5% using the signal threshold strategy.
Fig. 4.
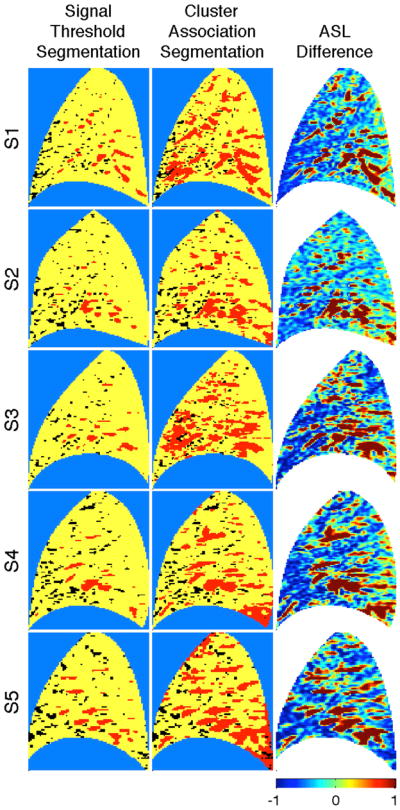
Segmentation results for each of the 5 subject images (S1–S5). The signal threshold segmentation is compared with the clustering association segmentation. For the signal threshold results, voxel samples exhibiting difference signal above and below the 35% signal criterion appear as red and yellow, respectively. For the association segmentation voxel samples exhibiting a posterior probability (with respect to the perfusion component) above and below p = 0.5 appear yellow and red, respectively. Voxel samples exhibiting a negative difference value are indicated in black. Corresponding ASL difference images (color represents variation about the image mean scaled in units of standard deviation) have been included for comparison.
For comparison, the images are accompanied by the corresponding ASL difference. To highlight heterogeneity, the ASL difference images are presented in terms of the deviation from the image mean normalized by the image standard deviation. It is interesting to note that the conduit signal footprint generated by cluster association segmentation is similar in terms of location, pattern, and size with the red features in both the ASL difference images. Within subject comparison demonstrates a high degree of test-retest reproducibilty with respect to the statistical properties. Averaged across the 5 subjects, the correlation coefficient values (between two ASL images selected at random within subject) for the components presented in Fig. 2 were calculated to be Pobs: ρ = 0.968; Pfit: ρ = 0.995; C1: ρ = 0.993; C2: ρ = 0.991.
IV. Discussion
A statistical clustering approach for identifying conduit flow image features in pulmonary perfusion ASL images has been presented. As there is no gold standard to use as a benchmark, the statistical clustering approach has been qualitatively compared to a commonly applied signal threshold approach. On comparison, the statistical clustering and signal threshold approaches to segmentation seem to identify (as conduit vessel signal) similar image features. Notably, however, the cluster association segmentation identifies a consistently larger footprint than the signal threshold segmentation. In interpreting this result, it is important to bear in mind that the 35% signal threshold criterion is a heuristic value that, while useful for identifying the most dominant conduit vessel features, nevertheless fails to account for conduit vessel contributions at intermediate and low signal levels. Comparison with the clustering footprint provides a measure of the extent to which the 35% threshold criterion misidentifies as perfusion voxels whose signal is dominated by conduit vessel signal contributions.
While an application to segmentation using healthy subjects has been presented as a demonstration of the clustering approach, it is important to emphasize that this is just one example of a potential application. In addition to offering a number of advantages over the difference signal threshold strategy, the ability to discriminate perfusion from conduit vessel signal contributions based on statistical properties holds promise as a potentially useful tool in the analysis of pulmonary ASL images and opens up interesting possibilities for future studies.
A. Application to the relative dispersion of perfusion
Consider the relative dispersion (RD), defined RD ≡ σ/μ, where μ and σ represent, respectively, the mean and standard deviation of the ASL signal averaged over the image (i.e. the instantaneous spatial mean and standard deviation of the blood flow). The RD is considered a relevant statistical measure of the global heterogeneity of blood flow throughout the lungs and a classic metric for characterizing the heterogeneity of pulmonary perfusion (8, 17).
The presence of conduit signal contributions tends to increase the heterogeneity of the image signal leading to an overestimation of the RD of perfusion (2, 8). By excluding the signal from the most dominant conduit signal image features from the averaging ensemble, the signal threshold strategy helps reduce the bias introduced by the conduit vessel signal contributions. Nevertheless, because signal thresholding does not account for the intermediate and low signal conduit contributions, the resulting RD value is still expected to overestimate the value that would result from heterogeneity at the level of capillary perfusion alone.
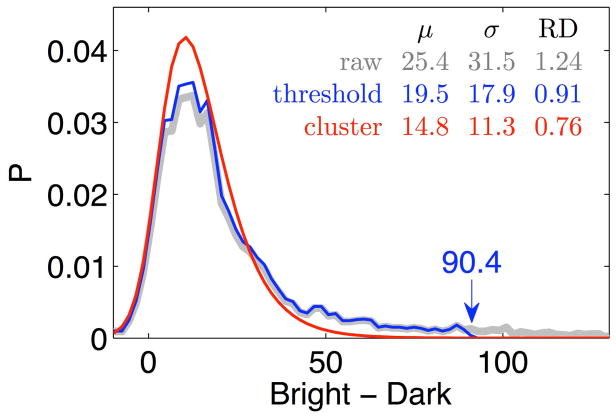
The clustering approach offers a potential improvement. As shown in Fig. 2, the clustering approach has yielded a pair of independent mixture components we have interpreted to represent the distributions of the perfusion (C1) and conduit (C2) signal contributions. Using the relation Z ≡ B − D to project into the difference domain, C1(D, B) → C1(Z), and normalizing, ∫∫dZ C1(Z) = 1, results in the PDF of perfusion in terms of the difference (i.e. flow proxy) signal. This PDF can then be used to generate the desired moments μ ≡ ∫ ZC1(Z)dZ, , yielding values for RD that are minimally influenced by the biasing effects of conduit signal contributions and therefore more representative of heterogeneity at the capillary level.
Figure 5 illustrates the influence of conduit signal bias on perfusion RD and the potential improvement offered by the clustering approach. The PDF corresponding to the signal threshold approach (indicated in blue) is truncated at the threshold (the 35% threshold criterion value is 90.4 in this example). In contrast, the statistical clustering result transitions smoothly to zero at the high end of the PDF. Note, each curve is normalized so that the area underneath each is 1.0. The corresponding μ, σ, and RD values show that signal thresholding results in a reduction in the RD value for perfusion with respect to the raw RD value, consistent with prior results (8, 12). The statistical clustering approach results in an even greater reduction in RD.
Fig. 5.
Probability density (P) as a function of the difference signal. Comparison between the cluster derived perfusion PDF (red), the raw image PDF (gray), and the truncated signal threshold PDF (blue). The 35% threshold criterion value is 90.4. The corresponding μ, σ, and RD values suggest that signal thresholding results in a reduction in the RD value for perfusion with respect to the raw RD value with clustering producing an even greater reduction, RD(no segmentation) = 1.24, RD(threshold) = 0.91, RD(statistical clustering) = 0.76.
B. Information added by using the bright and dark images MAYBE NEW NAME FOR THIS SECTION
There is a rich literature on the use of statistical clustering strategies for image analysis (14, 18). A key issue in mixture model design involves the choice for the number of cluster components to incorporate (19). The decision to use a two component model was largely motivated by the aims and assumptions of our study –namely the aim of discriminating two classes of signal contributions (perfusion vs. conduit vessel) under the assumption that the physiology of blood delivery to the pulmonary capillary bed leads to signal characteristics that can be statistically discriminated from contributions related to flow through conduit vessels. The decision to model the components as lognormal distributions stems from theoretical (20) and observational (8, 21) work that suggests that the statistical properties of pulmonary perfusion exhibit lognormal behavior. While imposing such a constraint on the functional form of the components may introduce a level of mismatch error, doing so greatly simplifies the computational load and provides a framework for interpreting the results. Despite the constraints, the two component lognormal model (comprising 12 independent parameters) still provides a high level of flexibility. Though the focus here has been healthy subjects, the model has shown similar promise over subjects exhibiting a wide range of pulmonary function. While it is possible to make different assumptions on the number and functional form of cluster components (or even not to impose a functional form constraint at all), in the end it is important to acknowledge that the results seem to validate the chosen model assumptions a-posteriori.
One might wonder whether the cluster approach could be applied directly to the ASL difference signal, with Z as the sole parameter. Figures 1 and 3 demonstrate that, by projecting the statistical analysis over a two parameter space, the bivariate bright/dark signal (Xn = [Dn, Bn]) provides an added degree of freedom that improves the ability to resolve the clusters (22).
C. Refining the cluster association segmentation approach
In the binary segmentation application discussed above, the signal associated with each voxel is interpreted as dominated by either the perfusion (p > 0.5) or conduit vessel (p < 0.5) signal contributions. While this approach seems to provide useful results, it is important to bear in mind that there can still be ambiguity about the nature of signal observed at many of the voxel locations. Consider a voxel sample for which the posterior probability is p = 0.51. Though identified as being dominated by perfusion signal contributions, there is still a significant probability, namely 1 − p = 0.49, that the signal is dominated by conduit signal contributions. This demonstrates one of the limitations of a classification scheme that does not accommodate class overlap – the simplicity provided by applying a mutually exclusive classification scheme comes at the cost of lost information.
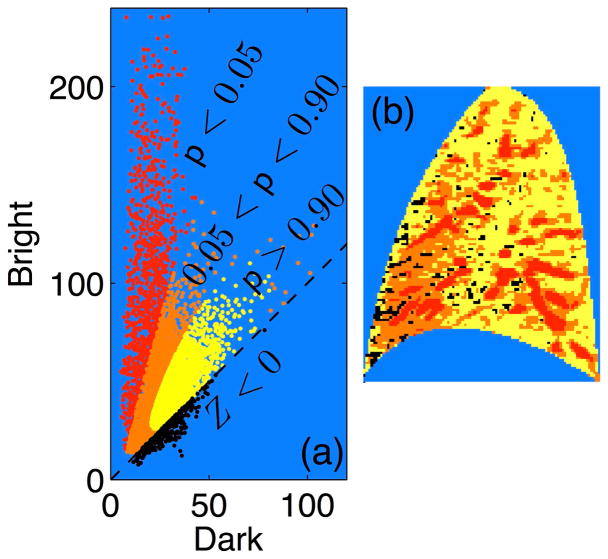
In reality, the signal associated with each voxel is not exclusively perfusion or conduit vessel in origin, but rather results from a superposition of contributions from both. Bearing in mind that the image plane has a thickness of around 15mm, it is entirely plausible and even quite likely that multiple vessels (small pulmonary capillaries as well as larger arterioles) may transect a given voxel. One approach for dealing with this ambiguity is to introduce segmentation levels that accommodate a degree of class overlap. As an example, consider the results presented in Fig. 6 which involves a more refined three level segmentation. Image features that are strongly associated with the perfusion (p > 0.95) and conduit components (p < 0.05) are indicated in yellow and red, respectively. Everything in between (0.05 < p < 0.95), indicated by orange, is more ambiguous. These are regions where it is likely that perfusion and conduit vessels both make significant signal contributions. Thus, we are able to identify regions whose signal is very likely (as opposed to simply more likely) to be dominated by either perfusion or conduit signal contributions. Although enhancing the characterization of the extremes comes at the cost of increased ambiguity for the intermediate regions, the ability to identify perfusion and/or dominated regions with increasing certainty may be of value for studies in which an unambiguous identification is required.
Fig. 6.
Refinement of cluster association segmentation. Panels (a) and (b) present a tri-level cluster association segmentation with two probability threshold values, p = 0.90 and p = 0.05: p > 0.90 (yellow), 0.90 > p > 0.05 (orange), and p < 0.05 (red). Voxels exhibiting Z < 0 indicated in black.
Another possibility is to move away from applying a defined threshold classification scheme entirely and interpret the posterior probability for a voxel as a proxy for the relative proportion of perfusion signal in that voxel. Under this interpretation, the perfusion proportion (i.e. the posterior probability value) for a given voxel is multiplied by the corresponding ASL difference signal. This type of approach is attractive as it holds promise for providing a direct estimate of perfusion at all locations that can be useful for studying the spatial distribution of pulmonary perfusion.
D. Summary
In summary we have presented a segmentation scheme to separate conduit vessel (tagged blood in transit to remote locations) from perfusion (delivery to local capillaries) signal contributions in an ASL MR pulmonary blood flow image that can serve as an alternative to the commonly used signal threshold cutoff strategy. By directly analyzing the bright and dark images, the proposed bi-component, log-normal statistical clustering approach benefits from additional information that is not available in the ASL difference image alone. Based on a small test sample of images, the statistical clustering segmentation approach produces a segmentation scheme that appears sensible and which smoothly eliminates the high signal voxels from each image.
Acknowledgments
This research was supported by funding from the following grants: NIH HL104118, NIH HL119263, and 1R21HL118539
Abbreviations
- ASL
arterial spin labeling
- RR
cardiac R wave-to-R wave interval
probability density function
- RD
relative dispersion
Appendix
It is assumed that the ensemble of voxel samples can be accurately modeled as a Gaussian mixture (13–15) comprising two linearly independent lognormal components. The model probability distribution function (PDF), denoted P(X̃), of the statistic X̃ ≡ ln X, then becomes, , where the jth component takes the form
with μj, Σj, and αj denoting the mean, covariance, and weighting, respectively, of Gaussian component j. By convention, vectors and matrices are denoted in bold, with matrices indicated by an additional underline notation with ⊤ denoting the transpose operation. Because the PDF must integrate to unity, the weighting parameters sum to unity, Σj αj = 1.
The model is optimized to the observed ensemble of voxel sample signal values (the set of N values of X̃n) using an expectation maximization approach (13–15) resulting in the set of parameters, {μj = μ̆j, Σj = Σ̆j, αj = ᾰj }, that maximizes the global log-likelihood of the model with respect to the set of observed samples. For the nth voxel sample, the posterior probability with respect to mixture component j is given by pj(X̃n) ≡ C̆j(X̃n)= P̆(X̃n) where notation ˘ denotes that the corresponding function is evaluated at maximal likelihood, {μj = μ̆j, Σj = Σ̆j, αj = ᾰj}.
References
- 1.Buxton RB. Quantifying CBF with arterial spin labeling. Journal of Magnetic Resonance Imaging. 2005;22(6):723–726. doi: 10.1002/jmri.20462. [DOI] [PubMed] [Google Scholar]
- 2.Bolar DS, Levin DL, Hopkins SR, Frank LF, Liu TT, Wong EC, Buxton RB. Quantification of regional pulmonary blood flow using ASL-FAIRER. Magnetic Resonance in Medicine. 2006;55(6):1308–1317. doi: 10.1002/mrm.20891. [DOI] [PubMed] [Google Scholar]
- 3.Levin DL, Buxton RB, Spiess JP, Arai T, Balouch J, Hopkins SR. Effects of age on pulmonary perfusion heterogeneity measured by magnetic resonance imaging. Journal of Applied Physiology. 2007;102(5):2064–2070. doi: 10.1152/japplphysiol.00512.2006. [DOI] [PubMed] [Google Scholar]
- 4.Prisk GK, Yamada K, Henderson AC, Arai TJ, Levin DL, Buxton RB, Hopkins SR. Pulmonary perfusion in the prone and supine postures in the normal human lung. Journal of Applied Physiology. 2007 Sep;103(3):883–894. doi: 10.1152/japplphysiol.00292.2007. [DOI] [PMC free article] [PubMed] [Google Scholar]
- 5.Hopkins SR, Henderson AC, Levin DL, Yamada K, Arai T, Buxton RB, Prisk GK. Vertical gradients in regional lung density and perfusion in the supine human lung: the Slinky effect. Journal of Applied Physiology. 2007 Jul;103(1):240–248. doi: 10.1152/japplphysiol.01289.2006. [DOI] [PMC free article] [PubMed] [Google Scholar]
- 6.Arai TJ, Henderson AC, Dubowitz DJ, Levin DL, Friedman PJ, Buxton RB, Prisk GK, Hopkins SR. Hypoxic pulmonary vasoconstriction does not contribute to pulmonary blood flow heterogeneity in normoxia in normal supine humans. Journal of Applied Physiology. 2009;106(4):1057–1064. doi: 10.1152/japplphysiol.90759.2008. [DOI] [PMC free article] [PubMed] [Google Scholar]
- 7.Burnham KJ, Arai TJ, Dubowitz DJ, Henderson AC, Holverda S, Buxton RB, Prisk GK, Hopkins SR. Pulmonary perfusion heterogeneity is increased by sustained, heavy exercise in humans. Journal of Applied Physiology. 2009;107(5):1559–1568. doi: 10.1152/japplphysiol.00491.2009. [DOI] [PMC free article] [PubMed] [Google Scholar]
- 8.Henderson AC, Prisk GK, Levin DL, Hopkins SR, Buxton RB. Characterizing pulmonary blood flow distribution measured using arterial spin labeling. NMR in Biomedicine. 2009:1025–1035. doi: 10.1002/nbm.1407. [DOI] [PMC free article] [PubMed] [Google Scholar]
- 9.Hopkins SR, Arai TJ, Henderson AC, Levin DL, Buxton RB, Kim Prisk G. Lung volume does not alter the distribution of pulmonary perfusion in dependent lung in supine humans. The Journal of Physiology. 2010;588(23):4759–4768. doi: 10.1113/jphysiol.2010.196063. [DOI] [PMC free article] [PubMed] [Google Scholar]
- 10.Hopkins SR, Wielpütz MO, Kauczor HU. Imaging lung perfusion. Journal of Applied Physiology. 2012;113(2):328–339. doi: 10.1152/japplphysiol.00320.2012. [DOI] [PMC free article] [PubMed] [Google Scholar]
- 11.Asadi AK, Cronin MV, Sa RC, Theilmann RJ, Holverda S, Hopkins SR, Buxton RB, Prisk GK. Spatial-temporal dynamics of pulmonary blood flow in the healthy human lung in response to altered FIO2. Journal of Applied Physiology. 2013 Jan;114(1):107–118. doi: 10.1152/japplphysiol.00433.2012. [DOI] [PMC free article] [PubMed] [Google Scholar]
- 12.Burrowes KS, Buxton RB, Prisk GK. Assessing potential errors of MRI-based measurements of pulmonary blood flow using a detailed network flow model. Journal of Applied Physiology. 2012 Jul;113(1):130–141. doi: 10.1152/japplphysiol.00894.2011. [DOI] [PMC free article] [PubMed] [Google Scholar]
- 13.Gupta L, Sortrakul T. A Gaussian-mixture-based image segmentation algorithm. Pattern Recognition. 1998;31(3):315–325. [Google Scholar]
- 14.Balafar MA, Ramli AR, Saripan MI, Mashohor S. Review of brain MRI image segmentation methods. Artificial Intelligence Review. 2010 Jan;33(3):261–274. [Google Scholar]
- 15.Zhang R, Thibault JB, Bouman CA, Sauer KD. Soft Classification with Gaussian Mixture Model for Clinical Dual-Energy CT Reconstructions. The 12th International Meeting on Fully Three-Dimensional Image Reconstruction in Radiology and Nuclear Medicine; Sep. 2013. [Google Scholar]
- 16.Mai VM, Berr SS. MR perfusion imaging of pulmonary parenchyma using pulsed arterial spin labeling techniques: FAIRER and FAIR. Journal of Magnetic Resonance Imaging. 1999 Mar;9(3):483–487. doi: 10.1002/(sici)1522-2586(199903)9:3<483::aid-jmri18>3.0.co;2-#. [DOI] [PubMed] [Google Scholar]
- 17.Hopkins SR, Garg J, Bolar DS, Balouch J, Levin DL. Pulmonary Blood Flow Heterogeneity during Hypoxia and High-Altitude Pulmonary Edema. American Journal of Respiratory and Critical Care Medicine. 2005 Jan;171(1):83–87. doi: 10.1164/rccm.200406-707OC. [DOI] [PubMed] [Google Scholar]
- 18.Pham DL, Xu C, Prince JL. Current Methods in Medical Image Segmentation. Annual Review of Biomedical Engineering. 2000 Aug;2(1):315–337. doi: 10.1146/annurev.bioeng.2.1.315. [DOI] [PubMed] [Google Scholar]
- 19.Gordon AD. Classification. 2. ch 3 Chapman & Hall/CRC; Boca Raton, FL: 1999. [Google Scholar]
- 20.Qian H, Bassingthwaighte JB. A class of flow bifurcation models with lognormal distribution and fractal dispersion. Journal of theoretical Biology. 2000;205(2):261–268. doi: 10.1006/jtbi.2000.2060. [DOI] [PubMed] [Google Scholar]
- 21.Wilson TA, Beck KC. Contributions of ventilation and perfusion inhomogeneities to the VA/Q distribution. Journal of Applied Physiology. 1992;72(6):2298–2304. doi: 10.1152/jappl.1992.72.6.2298. [DOI] [PubMed] [Google Scholar]
- 22.Coleman GB, Andrews HC. Image segmentation by clustering. Proceedings of the IEEE. 1979 May;67(5):773–785. [Google Scholar]


