
Fig. 2.
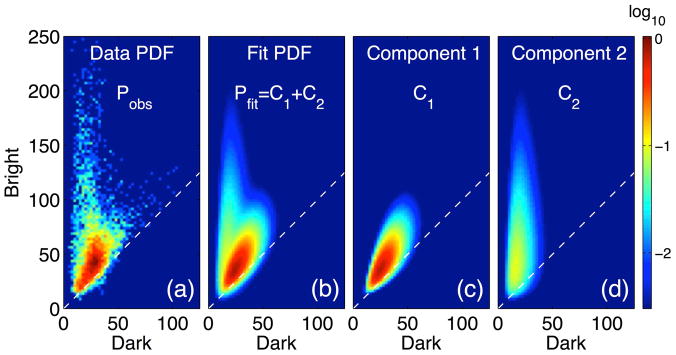
Mixture model solution. (a) Observed probability density function (PDF, a normalized 2-D histogram), Pobs, generated from the observed bivariate scatter plot representation in Fig. 1(c). Panel (b) presents the optimal fit, Pfit, to the observed PDF which can be decomposed into two components: (c) one identified with perfusion signal and (d) another identified with conduit signal. Color scale indicating PDF values is normalized and presented in log scale to facilitate viewing. Dashed lines indicate the contour of zero ASL difference signal (Z = 0).