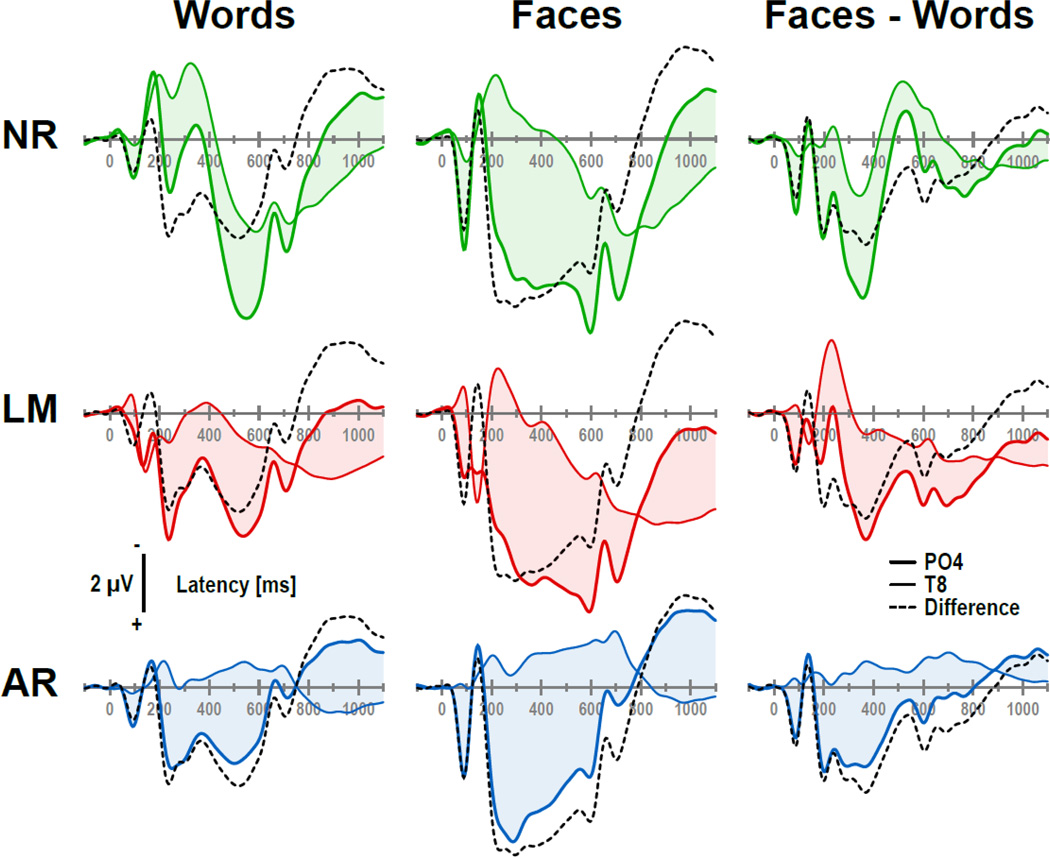
Figure 3.
Selected ERP waveforms (colored lines, PO4: thick, T8: thin) for words (column 1) and faces (column 2) as shown in Fig. 2, and ERP difference waveforms (i.e., faces-minus-words; column 3), comparing three common EEG references (NR: nose reference; LM: linked-mastoids reference; AR: average reference; colors as in Fig. 2). The shaded areas and the black dashed lines depict the differences between the two ERPs shown in each subgraph (i.e., thick-minus-thin colored lines). Relative ERP differences between any two sites are unaffected by the EEG reference, as revealed by identical difference waveforms in each column (dashed lines). It is obvious that any attempt to quantify deflections (i.e., peak and troughs) of the colored lines will yield different results for each EEG reference, notwithstanding their invariance in topography across references.

