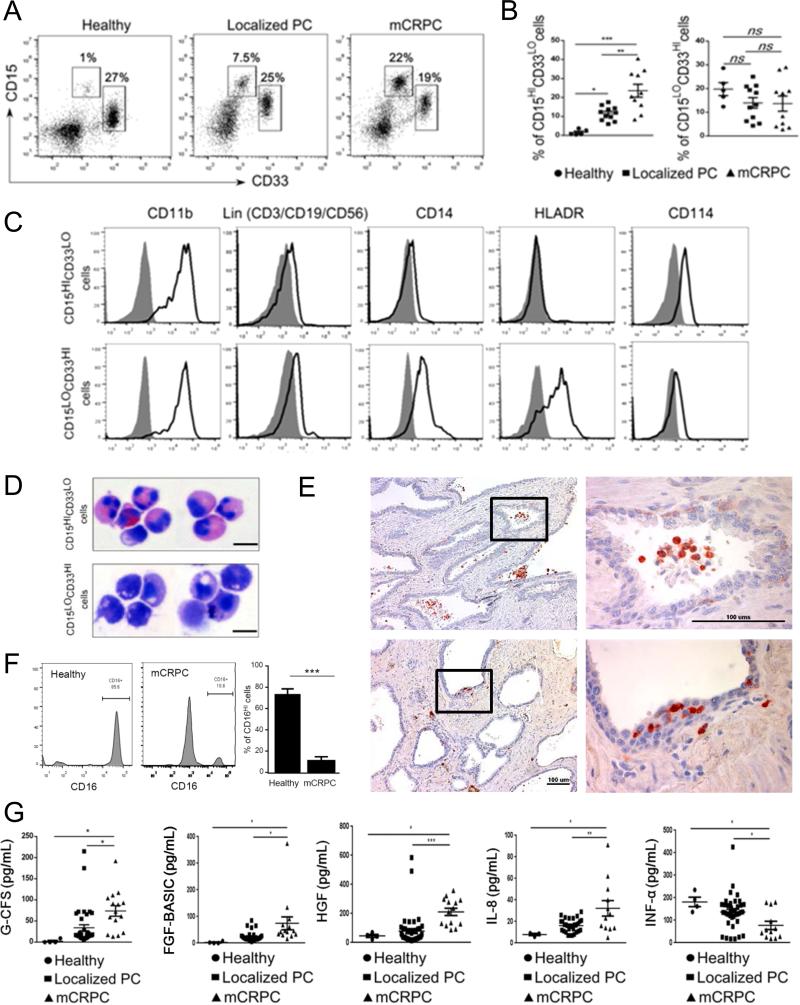
Figure 1. CD15HI myeloid cells accumulate in peripheral blood and tumor tissues in prostate cancer patients with disease progression.
(A-B) Flow cytometric analysis of fresh PBMCs from healthy subjects and prostate cancer patients with localized or metastatic disease. Representative dot plots (A) and graphs combining data from all subjects (B) showing percentages of CD15HICD33LO or CD15LOCD33HI cells in prostate cancer patients’ circulation at localized prostate cancers (PC) (n = 11) or metastatic tumors (mCRPC) (n = 10) compared to healthy donors (n = 5). Shown are means ± SD. (C) Representative histograms showing expression of lineage markers (Lin = CD3/CD19/CD56), CD11b, CD14, HLA-DR and CD114 (G-CSFR) among CD15LOCD33HI (top row) and CD15HICD33LO (bottom row) cells. (D) Cellular morphology of sorted, cytospinned and stained CD15HICD33LO or CD15LOCD33HI myeloid cells. Representative microphotographs showing monocytic (top) and granulocytic polymorphonuclear (PMN) phenotype (bottom) of CD15HICD33LO and CD15LOCD33HI cells, respectively. (E) CD15+ cells in cancer patients’ prostate tissues have granulocytic and PMN phenotype. Representative results of immunohistochemical staining on FFPE sections from two different patients (top and bottom); scale bar = 100 μm. (F) Mature CD16HI neutrophils are only minor fraction of circulating CD15HICD33LO cells in prostate cancer patients. The expression of CD16 was assessed on granulocytic cells from healthy subjects or prostate cancer patients. Shown are representative dot plot graphs (two left panels) and the summary of results from six different patients (right bar graph); means ± SD (n = 6). (G) Plasma levels of G-CSF and several other growth factors/chemokines increase with prostate cancer progression in contrast to reduced levels of proinflammatory IFNα. Luminex-based analysis of plasma samples from prostate cancer patients with localized (n = 25) or metastatic tumors (n = 15) compared to healthy individuals (n = 4). Statistically significant differences were indicated by asterisks; means ± SD.

