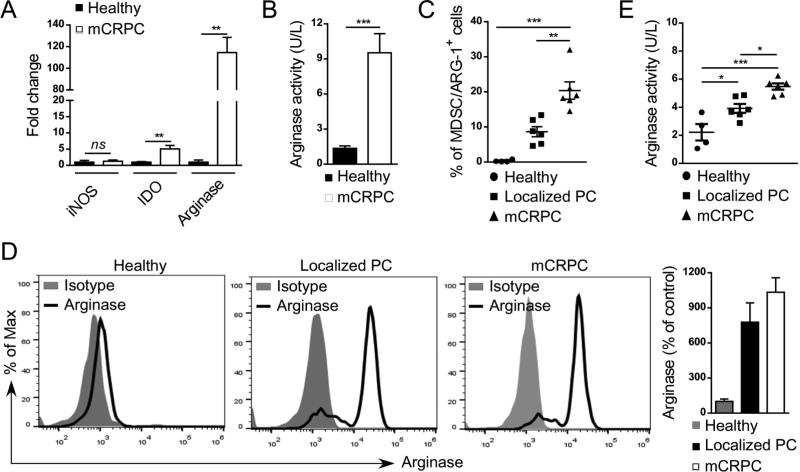
Figure 4. The percentage of arginase-expressing MDSCs increases with prostate cancer progression.
(A, B) Arginase 1 expression and activity is highly elevated in G-MDSCs from mCRPC patients. Levels of ARG1 mRNA in comparison to IDO and iNOS transcripts (A) as well as intracellular activity of Arginase 1 (B) were assessed in CD15+CD14− G-MDSCs using real-time qPCR and QuantiChrom™ assays, respectively. Shown are means ± SD (n = 4). (C) Prostate cancer progression correlates with increase in the percentage of arginase-expressing CD15HICD33LO G-MDSCs. Flow cytometric analysis comparing PBMCs from healthy individuals (n = 4) with prostate cancer patients with localized disease (n = 6) or mCRPCs (n = 6); means ± SD. (D) High intracellular levels of arginase expression in G-MDSCs from prostate cancer patients compared to granulocytes from healthy subjects as assessed using flow cytometry. Representative histograms (three left panels) and bar graph combining all data (right) from one of three experiments are shown; means ± SD. (E) Plasma levels of arginase activity increase with disease progression as measured in blood samples from in healthy individuals (n = 4), prostate cancer patients with localized (n = 6) and metastatic disease (n = 6); means ± SD. Statistically significant differences were indicated by asterisks.

