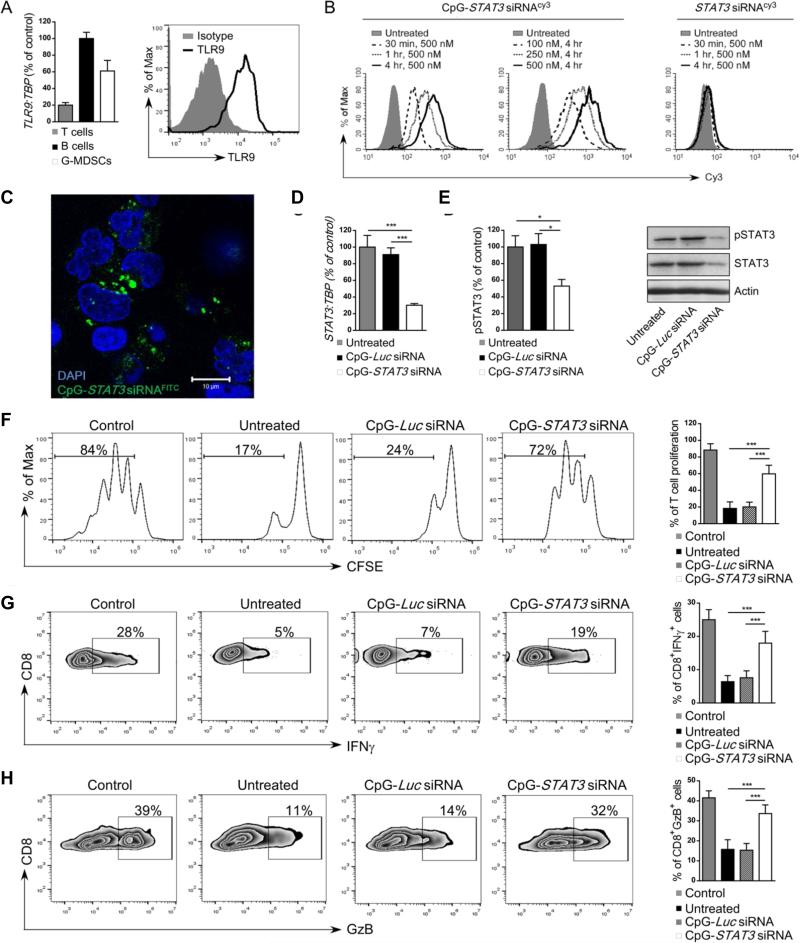
Figure 5. Targeted STAT3 silencing using CpG-STAT3siRNA strategy abrogates immunosuppressive activity of granulocytic MDSCs.
(A) CD15HICD33LO G-MDSCs express TLR9 at mRNA or protein levels as assessed by using real-time qPCR (left) or flow cytometry (right), respectively. CD19+ B cells and CD3+ T cells were used as positive and negative controls for qPCR analysis (left), respectively. (B) Dose- and time-dependent internalization of CpG-STAT3 siRNA by CD15HICD33LO MDSCs. PBMCs from prostate cancer patients were incubated with fluorescently-labeled CpG-STAT3 siRNACy3 conjugate or unconjugated STAT3 siRNACy3 for the indicated times and doses without any transfection reagents. Percentages of Cy3+ CD15HICD33LO MDSCs were assessed by flow cytometry; shown are representative results from one of three experiments. (C) STAT3 siRNA localizes to perinuclear/cytoplasmic cell compartment shortly after internalization. G-MDSCs (CD15+CD14−) enriched from mCRPC patient were incubated with 500 nM CpG-STAT3siRNAFITC for 1 h. The localization of the labeled siRNA part of the conjugate was assessed using confocal microscopy; scale bar = 10 μm. (D-E) CpG-STAT3 siRNA induces STAT3 silencing in fresh granulocytic MDSCs. The G-MDSCs enriched from prostate cancer patients’ PBMCs were treated with 500 nM CpG-STAT3 siRNA or CpG-Luc siRNA, used a s a negative control, for 48 h. The level of STAT3 inhibition was measured at mRNA level (D) using real time qPCR or at protein level using flow cytometry (E, left) or western blotting (E, right) after staining with antibodies specific to pSTAT3 and/or total STAT3. Statistically significant differences were indicated by asterisks; shown are means ± SD (n = 5). (F-H) CD15+CD14− MDSCs isolated from prostate cancer patients were treated with CpG-STAT3 siRNA or control CpG-Luc siRNA for 18 h and then co-cultured with autologous CD3+ T cells at 1:1 ratio with anti-CD3/CD28 stimulation. (F) T cell proliferation was determined by CFSE dilution assay after 72 h of co-culture with fresh MDSC. Under same experimental conditions percentages of IFNγ- (G) or Granzyme B- (H) producing CD8+ T cells were assessed using flow cytometry. Shown are representative data from one of two experiments (left four panels) and bar graphs (right panel) combining results from analyses of 5 individual patients’ samples; means ± SD. Statistically significant differences were indicated by asterisks.

