
Figure 4. Binding site 2 interface.
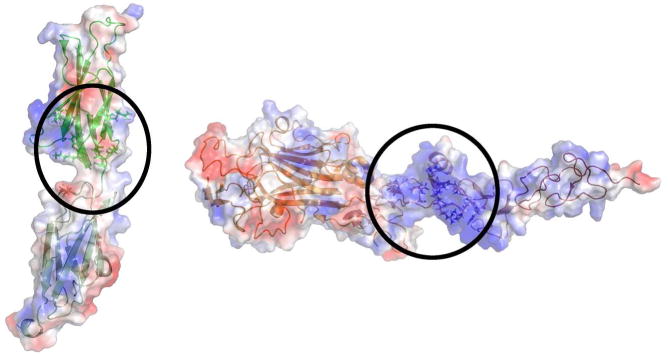
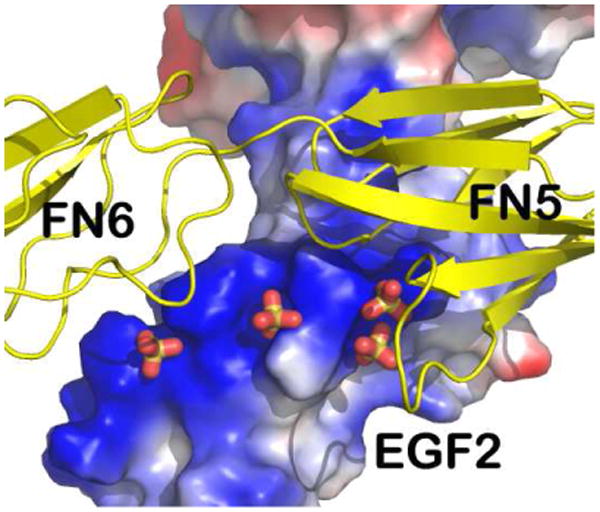
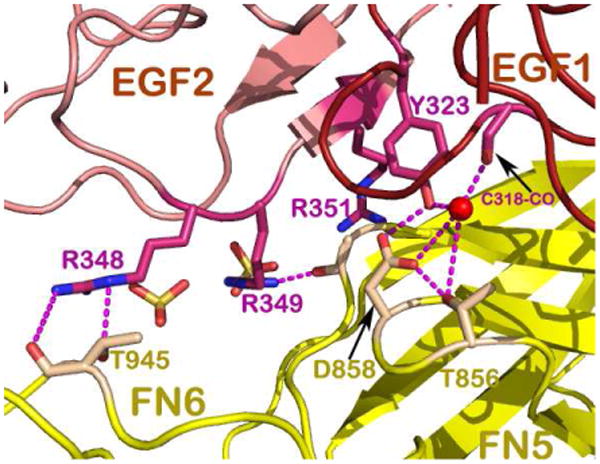
A. Open book views of the electrostatic surface potential representations of DCC and netrin-1 showing the positively charged interfaces encircled (Illustration modified form Finci et al, 2014). B. Zoom in view of binding site 2, depicting the DCC FN5 and FN6 domains in ribbon representation (colored green) and the netrin-1 EGF-1 and EGF-2 domains in electrostatic surface potential representation with sulfates mediating the interactions. C. A detailed view of binding site-2 interactions show the indispensible role of the DCC FN6 domain (the DCC FN5 and FN6 domains are both colored yellow) through interactions with arginines from the EGF-2 domain on netrin-1 (colored pink) interspersed with sulfates.