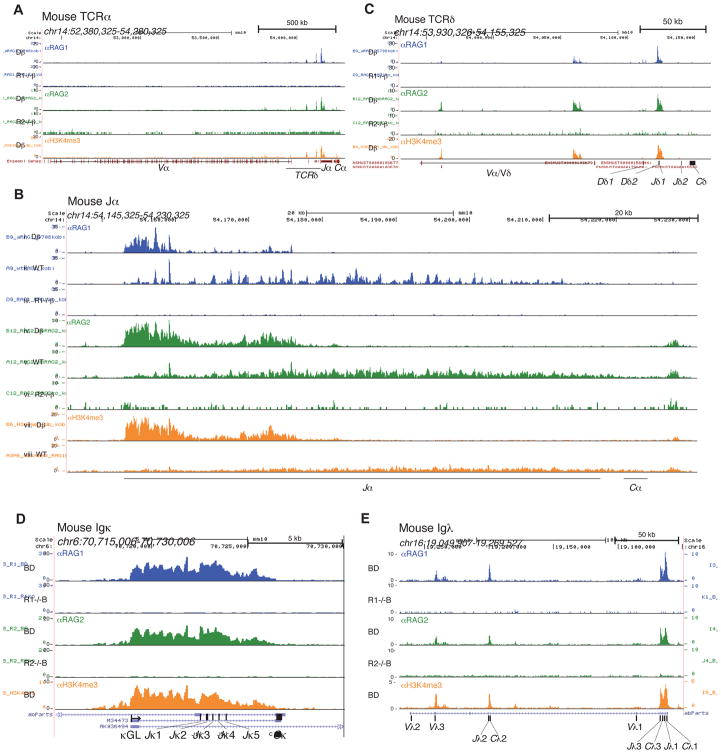
Figure 1. Recombination centers of antigen receptor genes.
ChIP-seq (reads per million mapped reads, in raw (unfiltered) form) for RAG1 (blue), RAG2 (green), and H3K4me3 (orange) are shown for selected antigen receptor genes in mouse lymphocytes. (A) The Tcrα/δ locus, (B) Tcrα recombination center (magnified), and (C) TCRδ recombination center (magnified) are shown for thymocytes. (D) The Igκ recombination center (magnified) and (E) Igλ locus are shown for pre-B cells. See also Figure S1.

