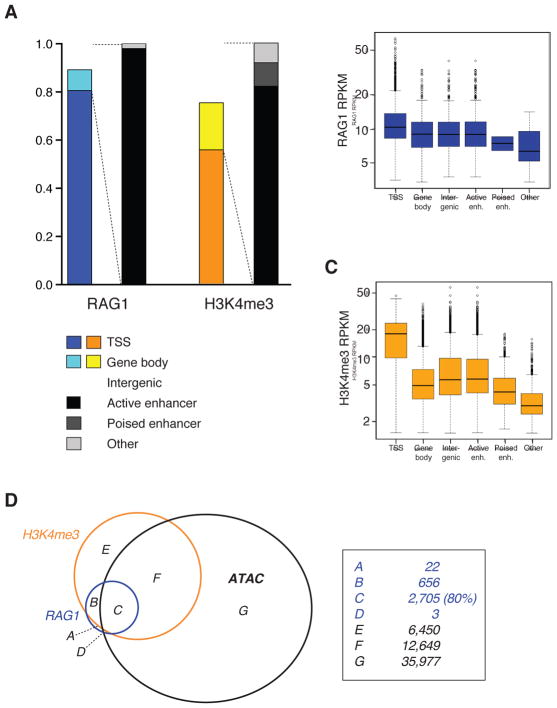
Figure 3. RAG1 binding sites overlap with TSSs and accessible chromatin.
(A) RAG1 and H3K4me3 peaks in mouse thymocytes were characterized by their overlap with TSSs (defined as +/− 2 kb from an annotated gene start position), gene bodies, or intergenic regions. Non-TSS peaks were further categorized as overlapping with active or poised enhancers. (B) RAG1 RPKM and (C) H3K4me3 RPKM are shown for each category of RAG1 peak. (D) Overlap between RAG1, H3K4me3, and accessible chromatin (defined by ATAC-seq) is shown for mouse pre-B cells. See also Figure S3.

