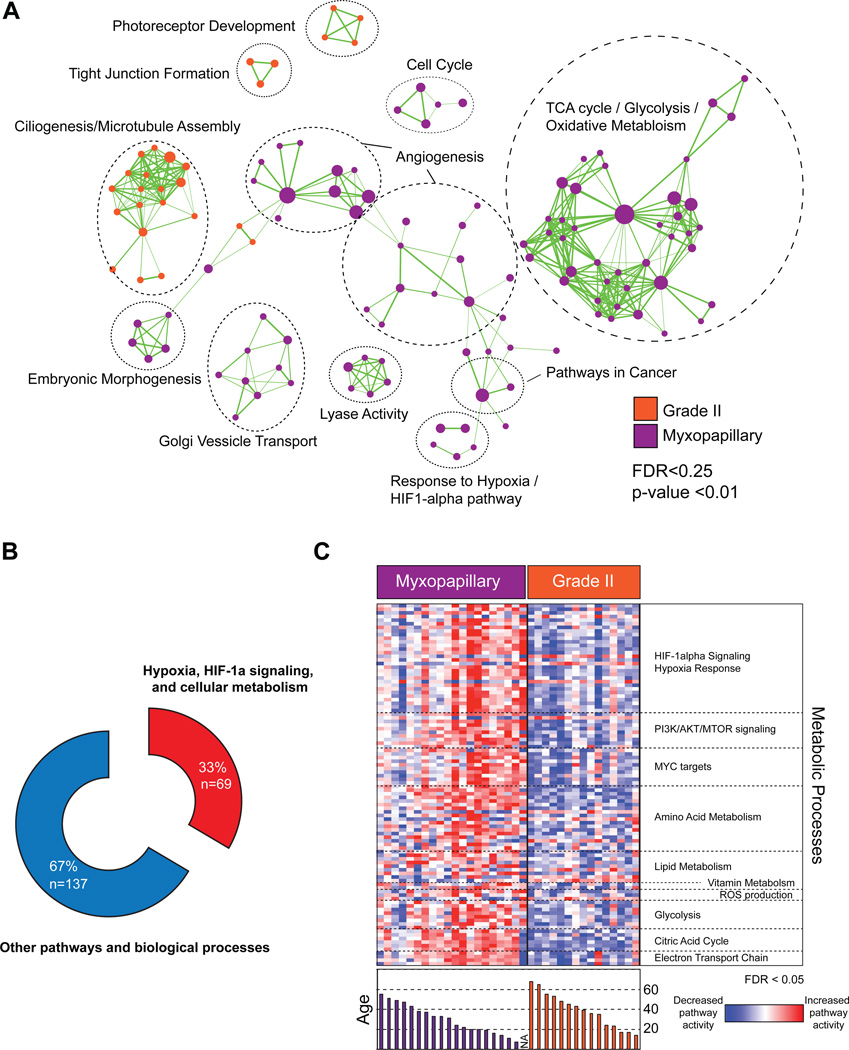
Figure 3. Pathway analysis identifies over-representation of metabolic gene sets in myxopapillary ependymoma.
(A) Cytoscape enrichment map of significant genesets distinguishing Grade II versus myxopapillary spinal ependymomas identified by Gene Set Enrichment Analysis (GSEA) and visualized in Cytoscape. A statistical significance cutoff of p < 0.01 and FDR < 0.25 was used for the pathway analysis
(B) Donut plot demonstrating significant over-representation of pathways and biological processes in involving hypoxia signaling and cellular metabolism in myxopapillary spinal ependymoma
(C) Single sample GSEA demonstrating subgroup-specific over-representation of pathways and biological processes involving cellular metabolism and hypoxia signaling. Bar graph of the ages of patients is shown in the lower panel.

